Climate Crisis: NASA’s Projected Changes

NASA_global_warming_predAs the world’s foremost space agency, NASA has been at the forefront of climate research for many decades. Their contributions to this field of science has helped to shape our understanding of the planet’s past and has led to our current understanding of the Greenhouse Effect, Global Warming, and Climate Change. As a result, they are committed to educating the public about what’s in store for our blue planet in the near future.

Below are two videos that were recently released by NASA’s Goddard Space Flight Center. Both briefly, but succinctly, provide visualizations of what an average temperature increase of up to 5.5 Celsius (8 degrees Fahrenheit) and the resulting effect on weather patterns would look like, which is expected to happen by the end of the 21st century.

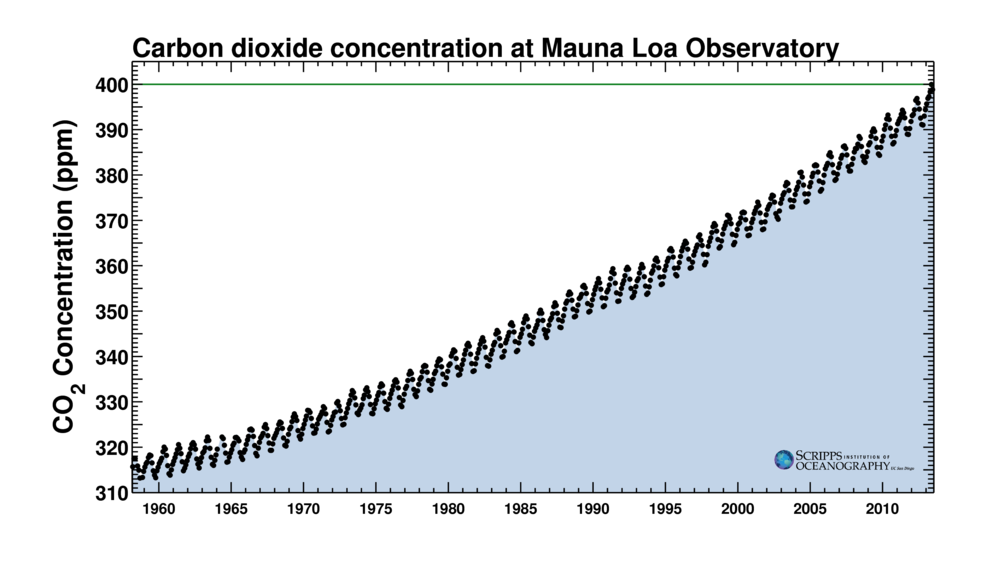
These visualizations – which highlight computer model projections from the draft National Climate Assessment – show how average temperatures and precipitation patterns could change across the U.S. in the coming decades under two different scenarios. As you can see, both predict significant warming and drying as a result of increased concentrations of CO2 in the upper atmosphere.

Projected Temperature Change by 2100:


Projected Precipitation Change by 2100:


The visualizations, which combine the results from 15 global climate models, present projections of temperature and precipitation changes from 2000 to 2100 compared to the historical average from 1970 -1999. They were produced by the Scientific Visualization Studio at NASA’s Goddard Space Flight Center, Greenbelt, Md., in collaboration with NOAA’s National Climatic Data Center and the Cooperative Institute for Climate and Satellites, both in Asheville, N.C.

Speaking on the subject of these videos, Allison Leidner, Ph.D. – a scientist who coordinates NASA’s involvement in the National Climate Assessment – said:

These visualizations communicate a picture of the impacts of climate change in a way that words do not. When I look at the scenarios for future temperature and precipitation, I really see how dramatically our nation’s climate could change.

But of course, these visualizations only tell part of the story. Far from this being a geographically restricted phenomena, residents inside the US are likely to be less severely hit than those people living in Sub-Saharan Africa, the Mediterranean, the Middle East, Central Asia, India and East Asia, where the problems of flooding, water loss, famine and drought area already common.

Add to this flooding coastlines, invasive parasites and diseases, militarized borders, potential skirmishes over dwindling resources, and a refugee crisis the likes of which the world has never seen, and you get a pretty good idea of why this issue matters as much as it does. The next century is going to be an interesting time. Here’s hoping we survive it!

Source: nasa.gov

Climate Crisis: Coming Trends in CO2

Pollution over Mexico CityGood news everybody! Okay, not exactly good, but it is news, and on a rather important subject. Recently, the National Oceanic and Atmospheric Administration (NOAA) announced that the Manua Loa observatory in Hawaii had recorded atmospheric levels of carbon dioxide which exceeded 400 parts per million. This represented a major milestone, one which climatological researchers and scientists have feared for some time.

However, they have since amended that statement, saying that the readings were a fraction of a point lower at 399.89 ppm. Not exactly a reason to celebrate, and not that surprising either, since individual readings at any of NOAA’s observation stations are subject to revision on a regular basis. And regardless of whether or not the 400 ppm milestone has been passed, scientists are still adamant that this reading is cause for concern.

keeling_curveAs has been stated repeatedly, when it comes to the buildup of human created greenhouse gases, it is the rate of increase which is most important. That rate, which is measured by the Keeling Curve, shows that atmospheric CO2 levels are rising at unprecedented rates, driven largely by the burning of fossil fuels over the past two centuries.

Originally pioneered by scientist Charles D. Keeling in 1958 , this curve is the longest-running tally of carbon dioxide levels in the atmosphere and is maintained by the Scripps Institution of Oceanography in San Diego. The saw-tooth pattern of the incline reflects small seasonal variations within the long-term upward trend, which peak annually around the month of May.

Combining this studies conducted on glacial melting patterns, pollination patterns, geological and oceanographic surveys, a long-term picture emerges. For the past 800,000 years, CO2 levels have never exceeded 300 ppm, and there is no known geologic period in which rates increased as sharply as they are now. That level was at about 280 ppm at the advent of the Industrial Revolution in the 18th century, the period when the burning of fossil fuels began to soar.

trafficScripps geochemist Ralph Keeling, who has taken over the Keeling curve measurement from his late father, had this to say about the news:

I wish it weren’t true, but it looks like the world is going to blow through the 400-ppm level without losing a beat. At this pace we’ll hit 450 ppm within a few decades.

Tim Lueker, an oceanographer and carbon cycle researcher who is a longtime member of the Scripps CO2 Group, also weighed in on the significance of these latest readings:

The 400-ppm threshold is a sobering milestone and should serve as a wake-up call for all of us to support clean-energy technology and reduce emissions of greenhouse gases before it’s too late for our children and grandchildren.

What’s especially frightening about a rating of 400 ppm is the fact that planet Earth has not experienced that kind of CO2 concentration for over 3 million years, during the Pliocene Era. At that time, sea levels were between 60 and 80 feet higher than their current levels. If sea levels rise by this much in the coming decades, roughly 1 billion of the Earths inhabitants will be left homeless.

climate_changetideAdd to this the widespread droughts, wildfires and flooding taking place in inland communities, where unpredictable weather will cause rivers to overflow erode river banks and turn millions more into refugees. And as crops fail due to increased heat and depleted topsoil, the ability to feed the world’s population will also begin to plummet.

Of course, these are the most dire predictions and are often used to remind us just how important it is to clean up our act before its too late. Researching and developing cleaner methods is one approach, as is finding ways to capture the carbon emissions we are generating on a daily basis. But in the end, the greatest weapon in our arsenal is and always will be public awareness.

Consider yourselves informed. Now go spread the word!

In the meantime, enjoy this animated “Carbon Tracker” graph that shows us the time history of atmospheric carbon dioxide – courtesy of the National Oceanic & Atmospheric Administration.


Source:
articles.latimes.com
, esrl.noaa.gov, keelingcurve.ucsd.edu