Climate Wars: Cropland Destruction and Improvement

cereals-agriculture-ear
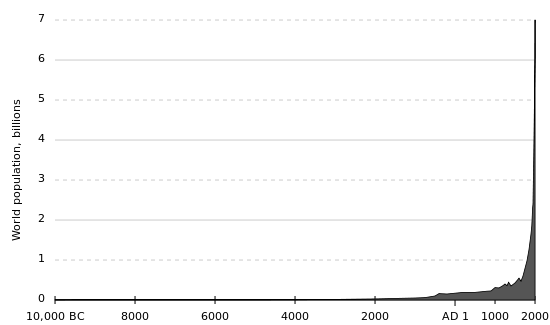
Climate Change is currently recognized as one of the greatest threats to the stability and well being of the world and its people. But far worse than rising sea levels, unpredictable weather patterns, and an increase in forest fires is the threat that it could have on the global food supply. As our population increases by several billion over the next few decades, these problems will make it even harder to feed everyone.

Up until now, predictions and projections have taken into account rising temperatures, drought, erosion, and longer growing seasons. But a recent study, produced by researchers at MIT and Colorado State University shows that air pollution is also a major factor. In their report, which was published in Nature Climate Change, they claim that ground-level ozone could exacerbate the effects on staple food crops like wheat, soybeans, maize, and rice.

crop_failureUsing two scenarios, researchers mapped out the tandem relationship between pollution and climate change. As a baseline, the MIT and Colorado State researchers estimate that climate change alone will result in a 11% decrease in global crop production. But if countries fail to substantially curb greenhouse gas emissions (the first scenario), the scientists’ model shows that air pollution could trigger an additional 4% of crop failures.

That means that barring significant changes, croplands could see a 15% drop in productivity in the next 40 years. But if countries work to decrease greenhouse gas emissions after 2040, the researchers’ model shows that reduced air pollution could actually offset other negative impacts of warming on crops. They calculate that reduced air pollution in this second scenario could actually increase yields by 3%.

Pollution over Mexico City
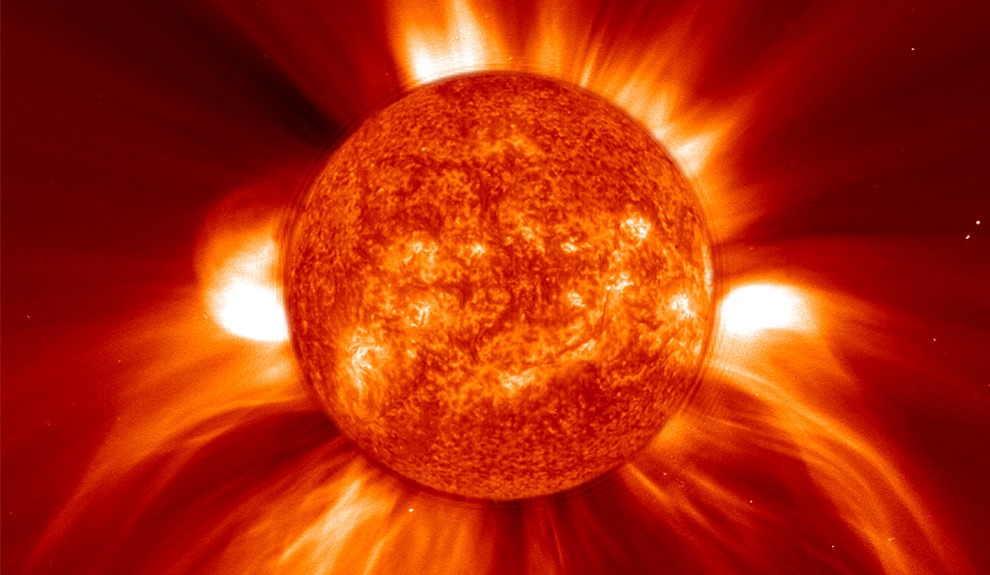
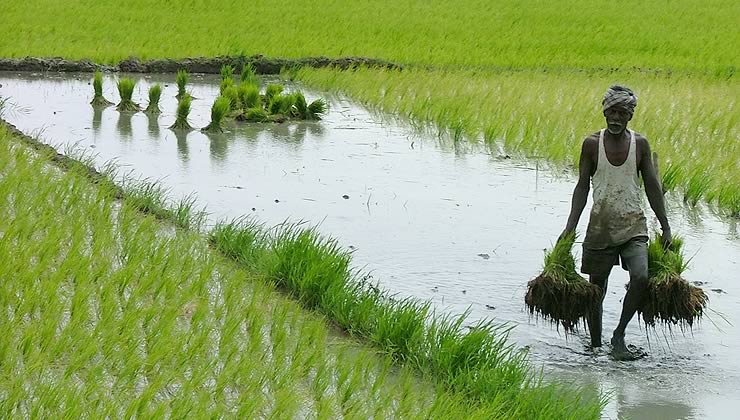
The link between air quality and food production may seem a bit odd, but the logic is actually very straightforward. Basically, the atmosphere forms ozone when sunlight energizes pollutants generated from sources like cars and power plants. Ozone concentrations can also increase at higher temperatures, the kind that already wither temperature-sensitive crops like maize. On top of the heat, increased ozone levels attack pollution-sensitive crops, like wheat.

In the climate scenario where emissions decrease after 2040, the reduction in ozone alone would be enough to increase wheat production in the U.S. and China, the researchers say. Their findings show that reducing air pollution could slow the negative impacts of climate change–even enough to reverse some of them. But some regions will be negatively impacted no matter what.

trafficAs Amos Tai, one of the study’s co-authors, explained:

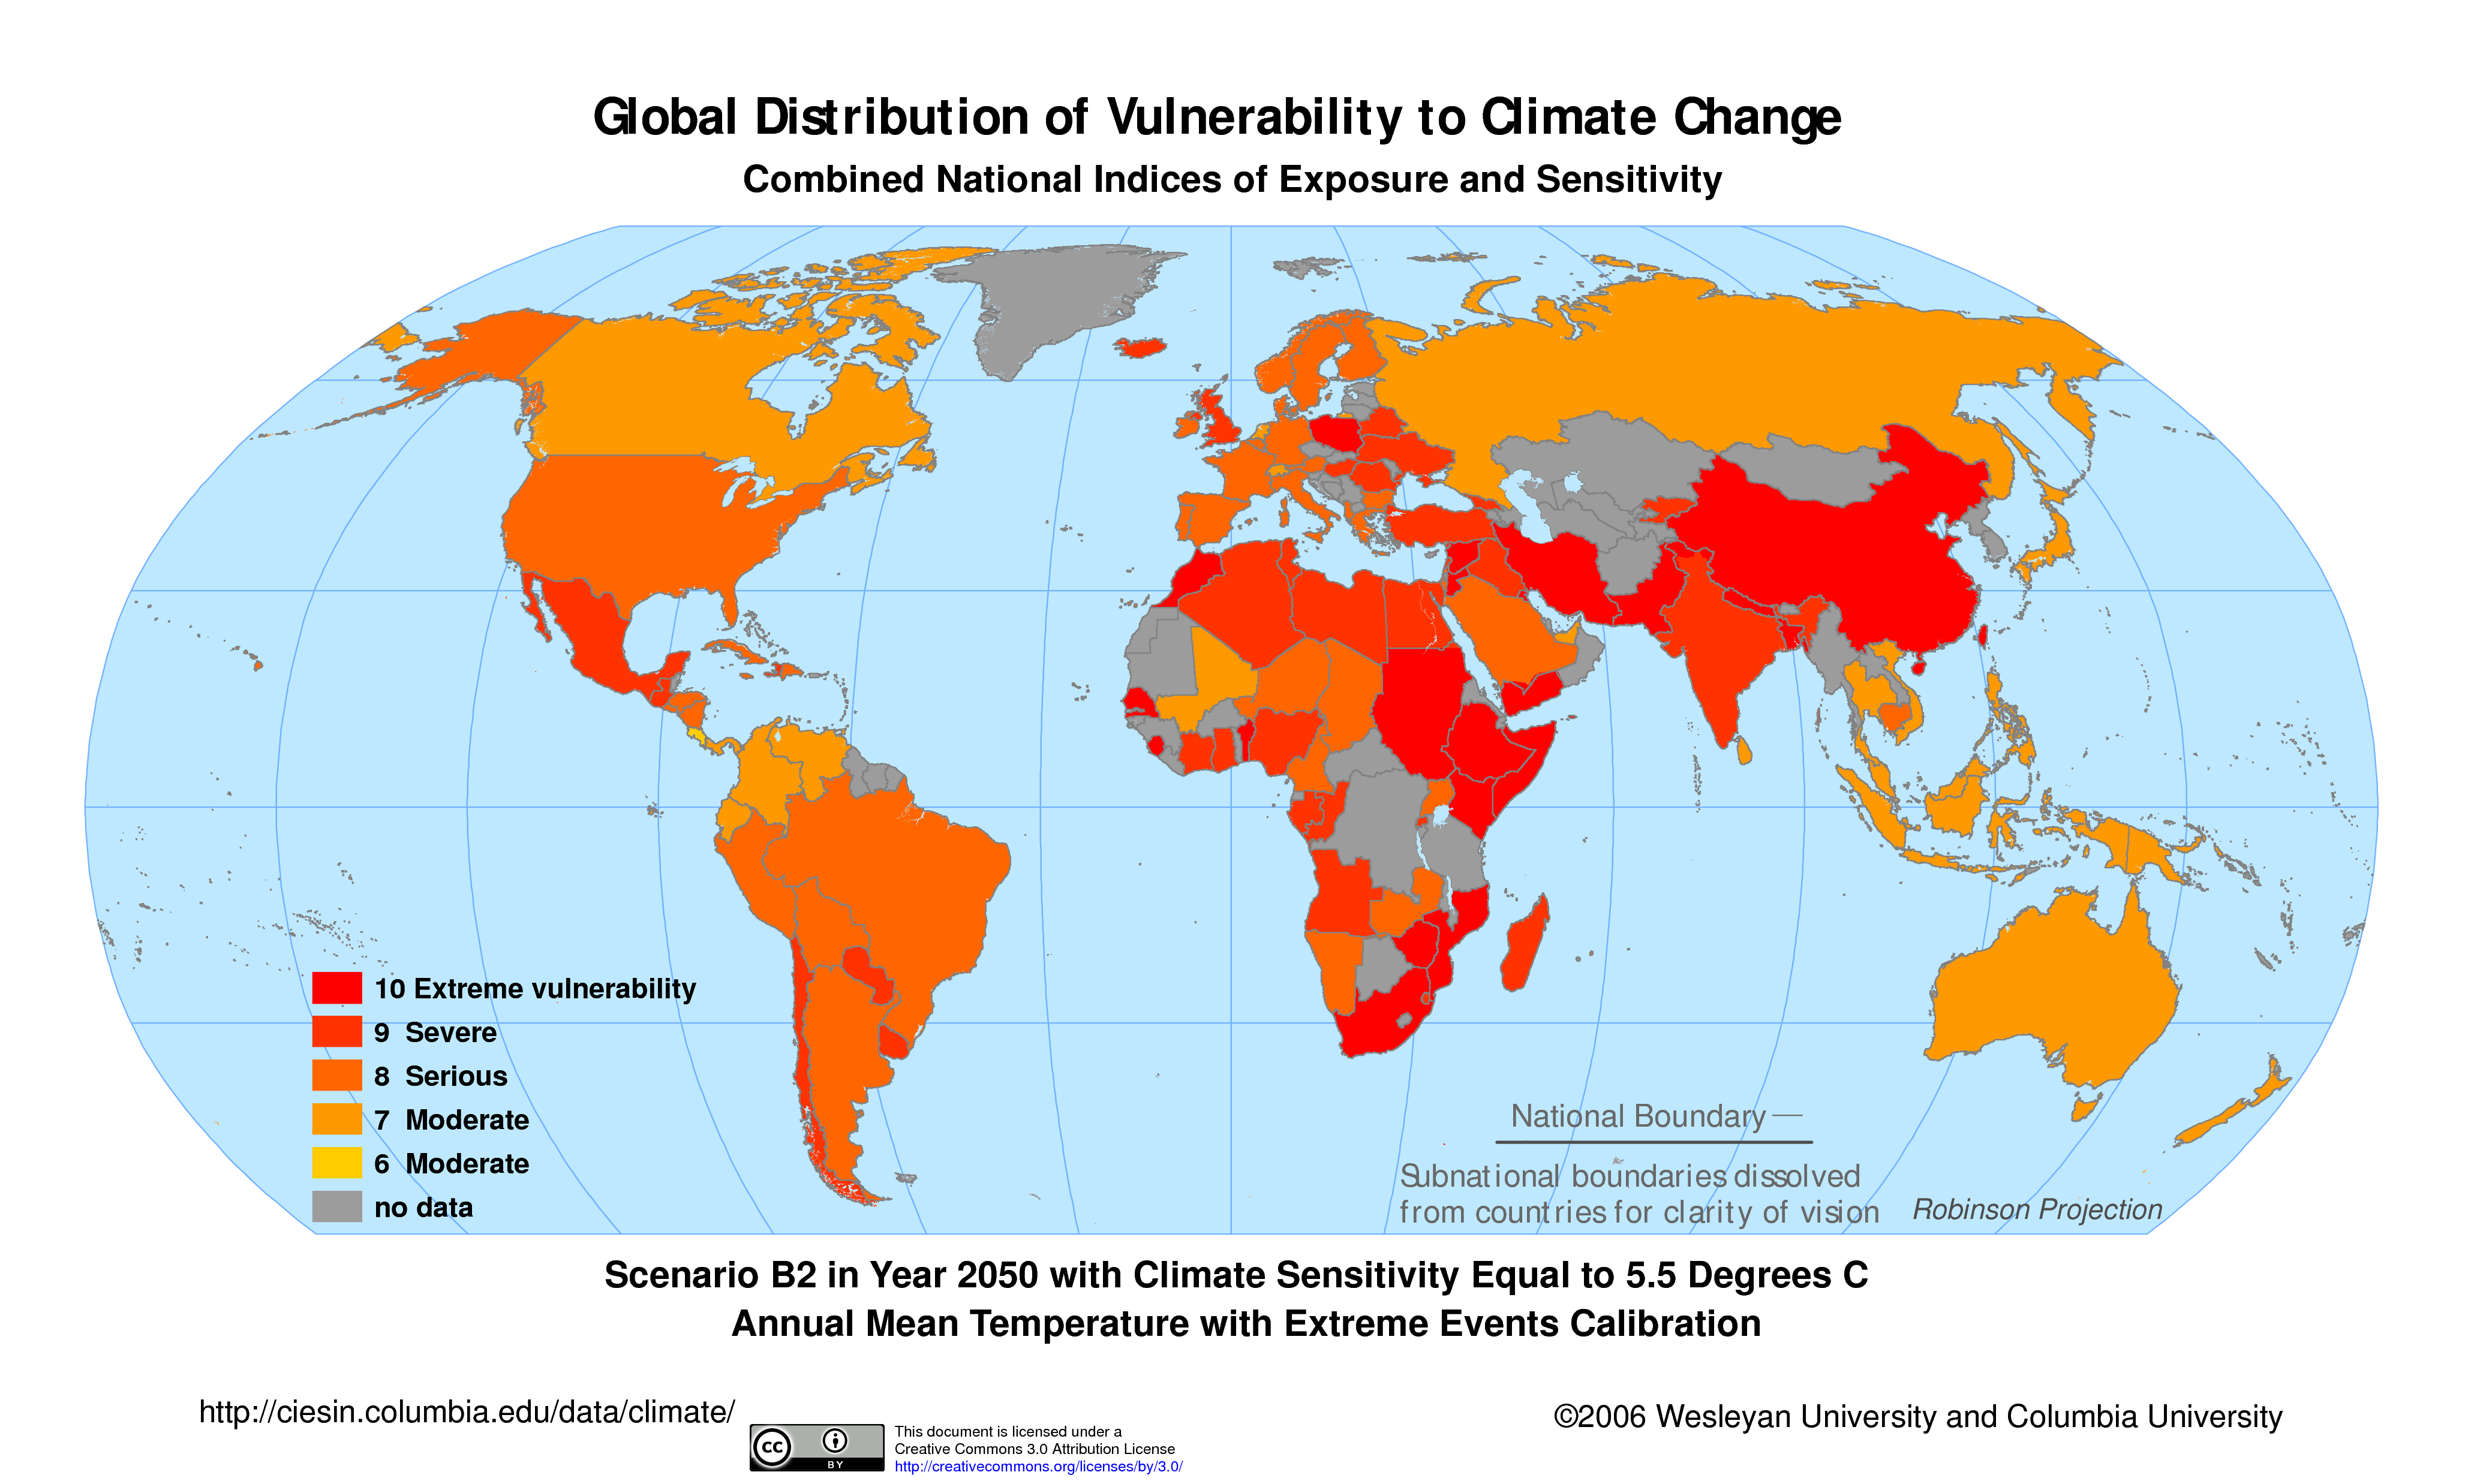
It appears that South Asia will be the most hard-hit by the combination of warming and ozone trends, where ozone is expected to increase even in the more optimistic scenario. African countries with low domestic production and heavily reliant on food imports are also expected to suffer more in terms of climate-pollution-driven food insecurity.

In short, food production is likely to suffer no matter what, but the effects could be confined to certain areas of the world. With proper management, and the provision of food to these regions from those that are unaffected (say, a pollution-fighting US and China), the worst could be avoided. And there’s some good news coming from another report, which claims we can further increase our food production without taxing the environment.

crop_growthAccording to a new report by researchers at the University of Minnesota’s Institute on the Environment, by focusing efforts to improve food systems on a few specific regions, crops and actions could make it possible to both meet the basic needs of three billion more people while simultaneously decreasing agriculture’s environmental carbon footprint. The report, published in Science back in July, may sound like fantasy, but the argument offered is logical and compelling.

The report focuses on 17 key crops that produce 86 percent of the world’s crop calories and account for most irrigation and fertilizer consumption. It then proposes a set of key actions in three broad areas that have the greatest potential for reducing the environmental impact of agriculture while boosting production. For each, it identifies specific “leverage points” where NGOs, foundations, governments, businesses and citizens can have the greatest impact.

agriculture_india
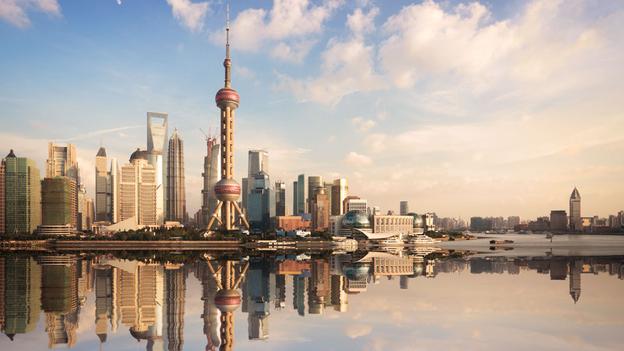
The biggest opportunities cluster in six countries – China, India, U.S., Brazil, Indonesia and Pakistan – along with Europe. As the report’s lead author Paul West, co-director of the Institute on the Environment’s Global Landscapes Initiative, explains:

This paper represents an important next step beyond previous studies that have broadly outlined strategies for sustainably feeding people. By pointing out specifically what we can do and where, it gives funders and policy makers the information they need to target their activities for the greatest good.

Overall, the report identified a number of major areas of opportunity and key leverage points for improving the efficiency and sustainability of global food production. First, there is reducing the “yield gap” – i.e. the difference between potential and actual crop yields – in many parts of the world. Currently, the largest gaps are to be found in Africa, Asia and Eastern Europe, and reducing it by just 50% could provide enough calories to feed 850 million more people.

china agriculture researchSecond, there is improving growth efficiency. The study identified two key areas where major opportunities exist to reduce climate impacts and improve efficiency of crop growth. These included the reduction of emissions of global greenhouse gas – which agriculture is responsible for 20 t0 35 percent of – in the form of CO2, tropical deforestation and methane, as well as improved efficiency in water usage.

In the case of emissions, the biggest opportunities are in Brazil and Indonesia where deforestation is a major problem, and in China, India and the US, where the production of rice, livestock, and crop fertilization all lead to sizable carbon and methane emissions. With respect to nutrient use, the study found that worldwide, 60 percent of nitrogen and nearly 50 percent of phosphorus applications exceed what crops need to grow.

agribusiness
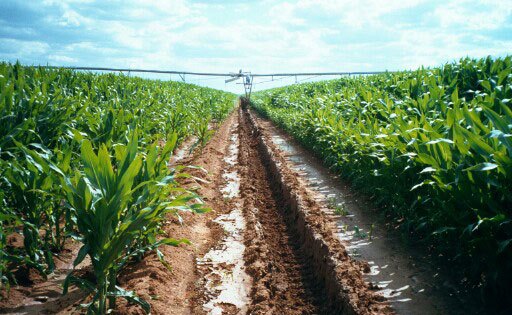
In the case of water usage, the greatest opportunities are in China, India and the US, where the production of rice, wheat and corn create the most demand for irrigation. India, Pakistan, China and the U.S. also account for the bulk of irrigation water use in water-limited areas. Thus, by boosting crop water use efficiency could also reduce water demand by 8 to 15% without compromising food production.

Third, the report calls for improved efficiency in crop use, which can be done by shifting crops from livestock to humans use and reducing food waste. Currently, the amount of crops fed to animals is sufficient to meet the calorie needs of 4 billion people. The U.S., China and Western Europe account for the bulk of this “diet gap,” with corn being the main crop diverted to animal feed. Shifting these crops could also form a “safety net” in the event of an unforeseen shortfall.

Last, but not least, the report calls for the elimination of food waste, which accounts for some 30 to 50 percent of food production worldwide. Again, the U.S., China and India are the major players, and reducing waste in these three countries alone could yield food for more than 400 million people. All told, these changes could allow for enough food for an additional 3 billion people, which is what the world population is expected to reach by 2050.

world_hungerOverall, West summarizes the report and its recommendations as follows:

Sustainably feeding people today and in the future is one of humanity’s grand challenges. Agriculture is the main source of water use, greenhouse gas emissions, and habitat loss, yet we need to grow more food. Fortunately, the opportunities to have a global impact and move in the right direction are clustered. By focusing on areas, crops and practices with the most to be gained, companies, governments, NGOs and others can ensure that their efforts are being targeted in a way that best accomplishes the common and critically important goal of feeding the world while protecting the environment. Of course, while calories are a key measure of improving food security, nutrition, access and cultural preferences must also be addressed. But the need to boost food security is high. So let’s do it.

As always, the good news is contained within the bad. Or more precisely, every crisis present us with an opportunity for change and advancement. Though Climate Change and air pollution may threaten current and future levels of food production, there are solutions. And in all cases, they present opportunities for healthier living, more efficient use of land and water, and a more sustainable way of meeting our most basic needs.

Sources: fastcoexist.com, sciencedaily.com

Climate Crisis: Present Changes and Coming Impacts

climate-changeThis Tuesday, the Whitehouse received the latest draft of the Climate Assessment Report, a scientific study produced by the National Climate Assessment to determine the impacts of Climate Change. In addition to outlining the risks it poses to various regions in the US, the report also addresses the apparent increase in the number of severe weather events that have taken place in the past few years, and how these events affect local economies and communities.

According to the 840-page report, America is fast becoming a stormy and dangerous place, with rising seas and disasters effecting regions from flood-stricken Florida to the wildfire-ravaged West. The report concluded that Climate change’s assorted harms “are expected to become increasingly disruptive across the nation throughout this century and beyond.” It also emphasized how warming and its all-too-wild weather are changing daily lives, even using the phrase “climate disruption” as another way of saying global warming.

Climate_Change_vulnerability_USHenry Jacoby, co-director of the Joint Program on the Science and Policy of Global Change at the MIT, was joined by other scientists and White House officials when he claimed that this is the most detailed and U.S.-focused scientific report on global warming. Above all, the most chilling claim contained within is the fact that “Climate change, once considered an issue for a distant future, has moved firmly into the present.”

The report also examined the effects at the regional and state-level, compared with recent reports from the UN that examined North America as a single case study. In a recent interview with CBC’s The Lang & O’Leary Exchange, Jacoby pointed to a range of impacts of global warming that people see everyday, from the change in the growing season, to extreme heat, severe Atlantic storms and drought in some areas.

climate_change_variableweatherAs he explained, these changes are far more than just variable weather:

If you look at what’s happening to the Arctic ice at your northern border, you are seeing changes to the ice like you haven’t seen in hundreds of years. We’re seeing change on a scale that’s going beyond variability.

A draft of the report was released in January 2013, but this version has been reviewed by more scientists, the National Academy of Science, 13 other government agencies, and was subject to public comment. It is written in a bit more simple language so people could realize “that there’s a new source of risk in their lives,” said study lead author Gary Yohe of Wesleyan University in Connecticut.

Even though the nation’s average temperature has risen by as much as 1.9 degrees since record keeping began in 1895, it’s in the big, wild weather where the average person feels climate change the most. As the report’s co-author Katharine Hayhoe – a Texas Tech University climate scientist – put it, extreme weather like droughts, storms and heat waves hit us in the pocketbooks and can be seen by our own eyes. And it’s happening a lot more often lately.

climate_change_precip
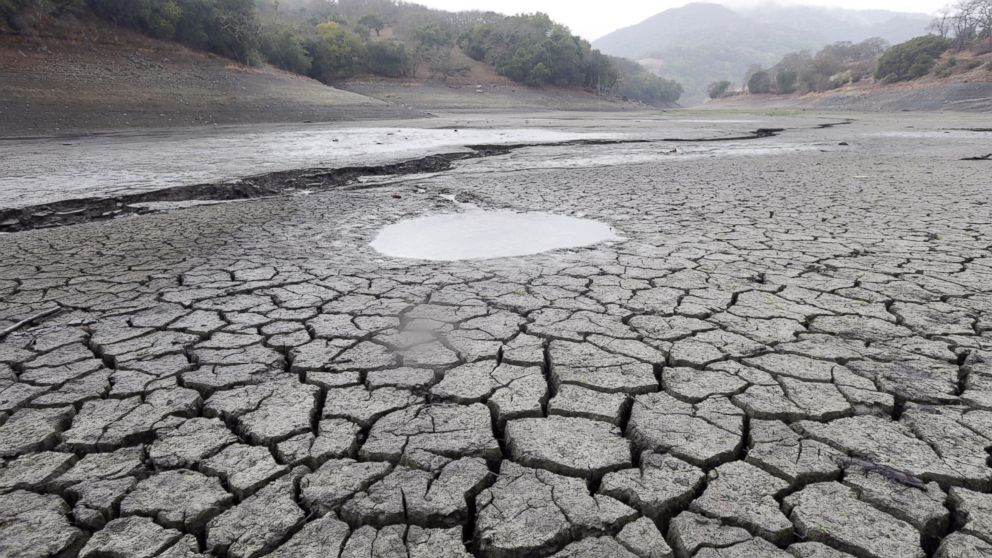
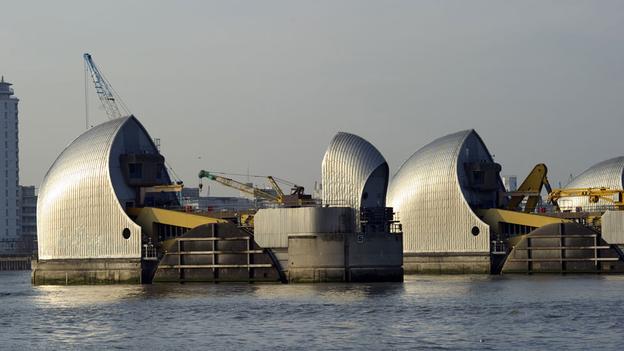
The report says the intensity, frequency and duration of the strongest Atlantic hurricanes have increased since the early 1980s. Winter storms have increased in frequency and intensity and shifted northward since the 1950s, with heavy downpours increasing by 71 per cent in the northeast alone. Heat waves are projected to intensify nationwide, with droughts in the southwest expected to get stronger. Sea levels have risen 20 centimetres since 1880 and are projected to rise between 0.3 meters and 1.2 metres by 2100.

The report was also clear that the 2010’s have been a record-setting decade. For example, since January 2010, 43 of the lower 48 states have set at least one monthly record for heat, such as California having its warmest January on record this year. In the past 51 months, states have set 80 monthly records for heat, 33 records for being too wet, 12 for lack of rain and just three for cold, according to an Associated Press analysis of federal weather records.

climate_change_tempsAs she described it, America is basically in a boxing match, and is currently on the ropes:

We’re being hit hard. We’re holding steady, and we’re getting hit in the jaw. We’re starting to recover from one punch, and another punch comes.

John Podesta, an adviser to President Barack Obama, said on Monday that the report includes “a huge amount of practical, usable knowledge that state and local decision-makers can take advantage of.” The report also stressed that climate change threatens human health and well-being in a number of ways. Those include smoke-filled air from more wildfires, smoggy air from pollution, more diseases from tainted food, water, mosquitoes and ticks.

climate_change_lossAnd then there’s more pollen because of warming weather and the effects of carbon dioxide on plants. Ragweed pollen season has lengthened by 24 days in the Minnesota-North Dakota region between 1995 and 2011, the report says. In other parts of the Midwest, the pollen season has gotten longer by anywhere from 11 days to 20 days. And all of this has associated costs, not the least of which is in damages, insurance costs, and health care expenses.

Flooding alone may cost $325 billion by the year 2100 in one of the worst-case scenarios, with $130 billion of that in Florida, the report says. Already the droughts and heat waves of 2011 and 2012 added about $10 billion to farm costs, the report says. Billion-dollar weather disasters have hit everywhere across the nation, but have hit Texas, Oklahoma and the southeast most often, the report says. And there is the impact on agricultural producers, which is also stressed:

Corn producers in Iowa, oyster growers in Washington state and maple syrup producers in Vermont are all observing climate-related changes that are outside of recent experience.

Climate_Change_vulnerability1Still, it’s not too late to prevent the worst of climate change, says the 840-page report, which the White House is highlighting as it tries to jump-start often stalled efforts to curb heat-trapping gases. However, if the U.S. and the world don’t change the way they use energy, the current effects will continue to intensify to the point where property damage, wildfires, storms, flooding and agricultural collapse will become untenable.

Already, the report has its detractors, many of whom appeared together for a Special Report segment on Fox News. In addition to commentator George Will questioning the scientific consensus – which accounts for 97% of the scientific community – Charles Krauthammer compared to the findings to a bargaining process, and ultimately condemned it as “superstition”. As he put it:

What we’re ultimately talking about here is human sin, through the production of carbon. It’s the oldest superstition around. It was in the Old Testament. It’s in the rain dance of the Native Americans. If you sin, the skies will not cooperate. This is quite superstitious and I’m waiting for science that doesn’t declare itself definitive but is otherwise convincing.

climate_change_denialNot to belabor the point, but superstition is what happens when people trust in rituals and practices that have no discernible effect whatsoever on a problem to protect themselves from said problem. Conducting research, performing field studies, and compiling statistics that cover hundreds, thousands, and even millions of years – this is called the scientific method. And Krauthammer would do well to realize that it is this same method that has done away with countless superstitious rituals throughout history.

He and other so-called skeptics (though a more accurate term is deniers) would also do well to understand the difference between superstition and a little thing known as cause and effect. For example, avoiding black cats, not walking under ladders, or sacrificing human beings to make the sun rise or the crops grow is superstition. Pumping thousands of tons of carbon dioxide into the air, which is known to have the effect of absorbing the sun’s thermal energy (aka. radiant forcing), is cause and effect.

See? Easily distinguished. But if there’s one thing that the “denial machine” has shown an affinity for, its remaining divorced from the scientific consensus. Luckily, they have been in full-retreat for some time, leaving only the most die hard behind to fight their battles. One can only hope their influence continues to diminish as time goes on and the problems associated with Climate Change get worse.

You can read the  full Climate Assessment Report here.

Sources: cbc.ca, abcnews.go.com, IO9.com, (2), nca2014.globalchange.gov

Climate News: World’s Most Potent Greenhouse Gas Found

NASA_global_warming_predFor over a century now, scientists have understood the crucial link that lies between greenhouse gases and the effect known as “Global Warming”. For decades, scientists have been focused on the role played by carbon dioxide and methane gas, the two principle polluters that are tied to human behavior and the consequences of our activities.

But now, a long-lived greenhouse gas, more potent than any other, has been discovered in the upper atmosphere by chemists at the University of Toronto. It’s known as Perfluorotributylamine (PFTBA), a gas that has a radiative efficiency of 0.86 – which is one measure of a chemical’s effectiveness at warming the climate (expressed in parts per million).

upper_atmosphereAt present, the biggest contributor to climate change is carbon dioxide, mainly because its concentrations are so high — 393.1 parts per million in 2012 and growing, thanks to human activity. However, many other gases contribute to this trend – such as nitrogen trifluoride and various chloroflurocarbons (CFCs) – but are less involved in the overall warming effect because their concentrations are lower.

According to the research article, which appeared in a recent issue of Geophysics Research Letters, the concentrations of PFTBA are very small — about 0.18 parts per trillion by volume in the atmosphere (at least in Toronto, where it was detected). But even though the overall contribution of PFTBA is comparatively small, its effect is “on the same scale as some of the gases that the monitoring community is aware of.”

Toronto Skyline With SmogAccording to 3M, a producer of PFTBA, the chemical has been sold for more than 30 years for the purpose of cooling semiconductor processing equipment and specialized military equipment, much in the same way that CFCs have been used. It is effective at transferring heat away from electronic components, and is stable, non-flammable, non-toxic, and doesn’t conduct electricity.

The chemical has an average lifespan of about 500 years in the lower atmosphere, and also like CFC’s, it has long been known to have the potential to cause damage to the ozone layer. But up until now its ability to trap heat in the atmosphere had not been measured, nor had it been detected in the atmosphere. The reason PFTBA is so potent compared to other gases is that it absorbs heat that would normally escape from the atmosphere.

electromagnetic-spectrumHeat, or infrared radiation comes, in different colors, and each greenhouse gas is only able to absorb certain colors of heat. PFTBA is different in that it manages to absorb colors that other greenhouse gases don’t. It was after some was discovered on the university grounds by Professor Scott Mabury that his team began to consider whether any had made it into the atmosphere as well.

Shortly thereafter, they conducted a series of tests to measure the radiative efficiency of the chemical and then began looking for samples of it in the air. This involved deploying air pumps to three locations – including the University of Toronto campus, Mt. Pleasant Cemetery and Woodbine Beach. The samples were then condensed and concentrated, and the PFTBA separated by weight.

airpollution1The end result was that PFTBA was found in all samples, including those upwind from the University of Toronto, suggesting that it wasn’t just coming from the chemistry building. However, the measurements were local and therefore not representative of the global average concentrations of the chemical. Still, its discovery is an indication that dangers might exist.

According to Angela Hong, a PhD student at the UofT department of chemistry and the lead author of the paper, this danger lies in the combined effect PFTBA could have alongside other gases:

If you’re suddenly going to add a greenhouse gas and it absorbs in that region. it’s going to be very potent.

Its effect is far more intense if its effect per molecule is considered, since it is about 15 times heavier than carbon dioxide. What’s more, PFTBA survives hundreds of years in the atmosphere, which means its effects are long-lasting. Fortunately, its use has been regulated under a U.S. Environmental Protection Agency program that promotes alternatives to chemicals that deplete the ozone layer.

pftba-toronto-537x402In addition, chemicals that deplete the ozone layer are recognized by the Kyoto Protocols. As such, it should be an easy matter (from a legal standpoint anyway) to legislate against its continued use. As 3M indicated in a recent press statement:

That regulation stipulates that PFCs [the class of chemical that PFTBA belongs to] should be used only where there are no other alternatives on the basis of performance and safety. 3M adheres to that policy globally.

It added that the company “has worked to limit the use of these materials to non-emissive applications” and emphasized that the concentration of PFTBA found in the atmosphere is very low.

????????????????Nevertheless, this represents good news and bad news when it comes to the ongoing issue of Climate Change. On the one hand, early detection like this is a good way of ensuring that gases that contribute to the problem can be identified and brought under control before they become a problem. On the other, it shows us that when it comes to warming, there are more culprits than previously expected to contributing to it.

According to the most recent IPCC report, which was filed in 2012, the likelihood of us reaching a critical tipping point – i.e. the point of no return with warming – this century is highly unlikely. But that still leaves plenty of room for the problem to get worse before it gets better. One can only hope we get our acts together before it’s too late.

Sources: cbc.ca, IO9

Climate Crisis: The Pacific Ocean’s Cooling Effect

pacific1Climatologists and environmental scientists have been cataloging the global warming trend for decades, examining multiple fields of data that show fluctuations over a period of eons. And despite what appears to be a consistent trend warming that has been taking place since the 18th century – when levels of atmospheric CO2 began to climb steadily – there have been anomalies in the data.

One period was the three decades that fall between the 1940’s and 1970’s when no significant terrestrial warming took place, and the Pacific Ocean was anomalously cold. The Pacific is somewhat of a wild card when it comes to our climate, since it is responsible for the weather patterns known as El Niño and La Niña that can swing global average temperatures by as much as 0.3 degree Celsius.

Global_Temperature_Anomaly_1880-2012.svgFor the past decade or so the tropical Pacific has again gone cold and a new study suggests that it may once again be related to the recent “pause” in global warming of average temperatures. Although the past decade also qualifies as the hottest on record, the trend has been milder than expected, with average surface temperatures plateauing for many years.

This is in stark contrast to the end of the 20th century, when rising concentrations of greenhouse gases in the atmosphere accelerated warming to new heights. To explain this, climate scientists Shang-Ping Xie and Yu Kosaka of the Scripps Institution of Oceanography at the University of California looked to the Pacific Ocean, using observable data and an advanced computer model.

NASA_global_warming_predThe latter came from the US Department of Commerce’s Geophysical Fluid Dynamics Laboratory computer model of the oceans and atmosphere. By adding in sea-surface temperatures of an oceanic area covering roughly 8 percent of the globe, the researchers were able to mimic the recent hiatus in global warming as well as weather phenomena like the prolonged drought in the southern US.

The results were published in the Aug. 29th edition of Nature Magazine. In it, Xie observed that the “tropical Pacific is the engine that drives the global atmosphere and climate. There were epochs of accelerated and stalled warming in the past.” This included the pause in a global warming trend between the 1940s and 1970s, which has often been attributed to sunlight-blocking air pollution from Europe, the Soviet Union and the US.

Pollution over Mexico CityOther factors have also been considered – volcanoes, an unusually weak solar cycle, air pollution from China – when looking at restraining trends in global warming. Some of the observed climate effects may also stem from other ocean dynamics such as variations in the mixing of surface and deep ocean waters. And the meltdown of significant ice from Greenland or Antarctica might even cool oceans enough to offset the extra heat trapped by rising levels of greenhouse gases for a time.

What is less clear at this point is what is driving cycles of cooling and heating of tropical Pacific Ocean waters. But it is clear that the cool Pacific pattern cannot persist forever to cancel out the extra heat trapped by rising CO2 concentrations, Xie notes. As climate modeler Gavin Schmidt of the NASA Goddard Institute for Space Studies recently stated:

We need updates to the forcings and a proper exploration of all the different mechanisms together. This has taken time but will happen soon-ish.

global-warming-trends_lrgAnd despite any pause in the trend toward hotter temperatures, the first decade of the 21st century was still the hottest recorded decade since the 1880s, and it included record heat waves in Russia and the US as well as a precipitous meltdown of Arctic sea ice and surging sea level rise. Atmospheric concentrations of CO2 touched 400 parts per million on Mauna Loa in May, a first in the time line of human existence.

A cooler Pacific due to prolonged La Niña activity may have restrained global warming for the past decade or so, but it is unlikely to last. As Xie noted:

This effect of natural variability will be averaged out over a period of 100 years. and cannot argue away the threat of persistent anthropogenic warming that is occurring now.

These warnings are key since any changes or anomalous readings are often seized upon by Climate Change deniers as evidence that the problem does not exist, is not man-made, or is at least not as severe as otherwise predicted. But in the coming decades, even the most benign scenarios are still fraught with peril. If the worst is to be averted, extensive and positive changes need to be made now.

Source: news.cnet.com, nature.com

Climate Crisis: Climate Bomb in the Arctic?

icecapThe northern polar regions are considered by many to be the main battle grounds when it comes to Climate Change. The slow melting of the planet’s ice caps are rapidly melting, which in turn leads to increasing sea levels, and an increase in the amount of solar radiation our oceans absorb. However, according to a new theory, the disappearance of the ice sheet might also release a “time bomb” of greenhouse gas.

The theory appeared in recent paper submitted to the journal Nature. which argued that warming temperatures could release 50 billion tons of methane currently frozen in the Arctic seabed. Because methane is a potent greenhouse gas, such a huge release could drastically speed up the rate at which the sea ice retreats, the amount of solar energy that the ocean absorbs, and exacerbate the ongoing melt.

NASA_global_warming_predIt could also mean global temperatures rising more quickly, moving the world’s climate past generally-agreed-upon “tipping point” limits. Using the same methodology as the Stern Review, a landmark study from 2006. the papers authors  – Gail Whiteman, Peter Wadhams, and Chris Hope of Cambridge University – put a price tag on the potential damage:

The release of methane from thawing permafrost beneath the East Siberian Sea, off northern Russia, alone comes with an average global price tag of $60 trillion in the absence of mitigating action–a figure comparable to the size of the world economy in 2012 (about $70 trillion). The total cost of Arctic change will be much higher.

Using various scenarios, they say the methane could take from 10 to 50 years to emerge. But they’re clear about who’ll be hit hardest:

The economic consequences will be distributed around the globe, but the modeling shows that about 80% of them will occur in the poorer economies of Africa, Asia and South America. The extra methane magnifies flooding of low-lying areas, extreme heat stress, droughts and storms.

This is certainly consistent with existing Climate Change scenarios that predict the presence of severe drought in Central and South America, sub-Saharan Africa, and South and East Asia – the most populous regions of the Earth accounting for roughly 3 billion people.

Pollution over Mexico CityHowever, there are those who dispute this theory beyond the usual crop of Climate Change deniers. According to these dissenting views, the methane is unlikely to escape to the atmosphere as quickly as the paper predicts, and that some of it could be broken down in the ocean.

But Nafeez Ahmed, director of the Institute for Policy Research and Development, says these skeptics are relying on outdated models. The reality on the ground, as captured by scientists with the International Arctic Research Center, is that temperatures are rising faster than elsewhere and that current ice melt is consistent with the methane effect.

Global_Warming_Predictions_MapTo make matters worse, even if the methane emerges slowly, it would still be catastrophic. The research performed by Whiteman, Wadham, and Hope shows that the effects will be the same, regardless of whether or the methane is released over a 50 year period or a 10 year period. The key is mitigating factors, which call for immediate and ongoing intervention to ensure that worst doesn’t happen.

Bad news indeed, and it further demonstrates the dangers of what is referred to as a the “feedback mechanism” of Climate Change. As things get worse, we can expect the rate at which they get worse to increase at every step. And considering the likely social, political and economic impact of these changes, the ramifications of these new predictions are dire indeed.

Source: fastcoexist.com

Climate Crisis: NASA’s Projected Changes

NASA_global_warming_predAs the world’s foremost space agency, NASA has been at the forefront of climate research for many decades. Their contributions to this field of science has helped to shape our understanding of the planet’s past and has led to our current understanding of the Greenhouse Effect, Global Warming, and Climate Change. As a result, they are committed to educating the public about what’s in store for our blue planet in the near future.

Below are two videos that were recently released by NASA’s Goddard Space Flight Center. Both briefly, but succinctly, provide visualizations of what an average temperature increase of up to 5.5 Celsius (8 degrees Fahrenheit) and the resulting effect on weather patterns would look like, which is expected to happen by the end of the 21st century.

These visualizations – which highlight computer model projections from the draft National Climate Assessment – show how average temperatures and precipitation patterns could change across the U.S. in the coming decades under two different scenarios. As you can see, both predict significant warming and drying as a result of increased concentrations of CO2 in the upper atmosphere.

Projected Temperature Change by 2100:


Projected Precipitation Change by 2100:


The visualizations, which combine the results from 15 global climate models, present projections of temperature and precipitation changes from 2000 to 2100 compared to the historical average from 1970 -1999. They were produced by the Scientific Visualization Studio at NASA’s Goddard Space Flight Center, Greenbelt, Md., in collaboration with NOAA’s National Climatic Data Center and the Cooperative Institute for Climate and Satellites, both in Asheville, N.C.

Speaking on the subject of these videos, Allison Leidner, Ph.D. – a scientist who coordinates NASA’s involvement in the National Climate Assessment – said:

These visualizations communicate a picture of the impacts of climate change in a way that words do not. When I look at the scenarios for future temperature and precipitation, I really see how dramatically our nation’s climate could change.

But of course, these visualizations only tell part of the story. Far from this being a geographically restricted phenomena, residents inside the US are likely to be less severely hit than those people living in Sub-Saharan Africa, the Mediterranean, the Middle East, Central Asia, India and East Asia, where the problems of flooding, water loss, famine and drought area already common.

Add to this flooding coastlines, invasive parasites and diseases, militarized borders, potential skirmishes over dwindling resources, and a refugee crisis the likes of which the world has never seen, and you get a pretty good idea of why this issue matters as much as it does. The next century is going to be an interesting time. Here’s hoping we survive it!

Source: nasa.gov

Climate Crisis: Coming Trends in CO2

Pollution over Mexico CityGood news everybody! Okay, not exactly good, but it is news, and on a rather important subject. Recently, the National Oceanic and Atmospheric Administration (NOAA) announced that the Manua Loa observatory in Hawaii had recorded atmospheric levels of carbon dioxide which exceeded 400 parts per million. This represented a major milestone, one which climatological researchers and scientists have feared for some time.

However, they have since amended that statement, saying that the readings were a fraction of a point lower at 399.89 ppm. Not exactly a reason to celebrate, and not that surprising either, since individual readings at any of NOAA’s observation stations are subject to revision on a regular basis. And regardless of whether or not the 400 ppm milestone has been passed, scientists are still adamant that this reading is cause for concern.

keeling_curveAs has been stated repeatedly, when it comes to the buildup of human created greenhouse gases, it is the rate of increase which is most important. That rate, which is measured by the Keeling Curve, shows that atmospheric CO2 levels are rising at unprecedented rates, driven largely by the burning of fossil fuels over the past two centuries.

Originally pioneered by scientist Charles D. Keeling in 1958 , this curve is the longest-running tally of carbon dioxide levels in the atmosphere and is maintained by the Scripps Institution of Oceanography in San Diego. The saw-tooth pattern of the incline reflects small seasonal variations within the long-term upward trend, which peak annually around the month of May.

Combining this studies conducted on glacial melting patterns, pollination patterns, geological and oceanographic surveys, a long-term picture emerges. For the past 800,000 years, CO2 levels have never exceeded 300 ppm, and there is no known geologic period in which rates increased as sharply as they are now. That level was at about 280 ppm at the advent of the Industrial Revolution in the 18th century, the period when the burning of fossil fuels began to soar.

trafficScripps geochemist Ralph Keeling, who has taken over the Keeling curve measurement from his late father, had this to say about the news:

I wish it weren’t true, but it looks like the world is going to blow through the 400-ppm level without losing a beat. At this pace we’ll hit 450 ppm within a few decades.

Tim Lueker, an oceanographer and carbon cycle researcher who is a longtime member of the Scripps CO2 Group, also weighed in on the significance of these latest readings:

The 400-ppm threshold is a sobering milestone and should serve as a wake-up call for all of us to support clean-energy technology and reduce emissions of greenhouse gases before it’s too late for our children and grandchildren.

What’s especially frightening about a rating of 400 ppm is the fact that planet Earth has not experienced that kind of CO2 concentration for over 3 million years, during the Pliocene Era. At that time, sea levels were between 60 and 80 feet higher than their current levels. If sea levels rise by this much in the coming decades, roughly 1 billion of the Earths inhabitants will be left homeless.

climate_changetideAdd to this the widespread droughts, wildfires and flooding taking place in inland communities, where unpredictable weather will cause rivers to overflow erode river banks and turn millions more into refugees. And as crops fail due to increased heat and depleted topsoil, the ability to feed the world’s population will also begin to plummet.

Of course, these are the most dire predictions and are often used to remind us just how important it is to clean up our act before its too late. Researching and developing cleaner methods is one approach, as is finding ways to capture the carbon emissions we are generating on a daily basis. But in the end, the greatest weapon in our arsenal is and always will be public awareness.

Consider yourselves informed. Now go spread the word!

In the meantime, enjoy this animated “Carbon Tracker” graph that shows us the time history of atmospheric carbon dioxide – courtesy of the National Oceanic & Atmospheric Administration.


Source:
articles.latimes.com
, esrl.noaa.gov, keelingcurve.ucsd.edu

Climate Crisis: Rising Tides and Sinking Cities

climate_changetideWith all the population, urban sprawl, and consumption that we as a species are imposing on the planet, there are those who argue that we’ve entered a new geological era – known as the Anthropocene. It’s an age we’ve lived in since the neolithic revolution and the advent of farming, one where the human race is the dominant force shaping our planet. Since the industrial revolution, this era has been accelerating and escalating, and things are not likely to get better anytime soon.

It is because of this that we need to contemplate what the near future will look like. Consider the recent floods in the Canadian Prairies, or last year’s wildfires which raged across the American midwest. Consider the famines and shortages that led to a world food price crisis in 2007-8 which had serious political consequences, especially in the Middle East (i.e. the Arab Spring).

climate_changesandyWhen you add to this the fact that rising tides and the increased risk of storms are already effecting coastal communities in severe ways, you begin to understand just how turbulent the next few decades are likely to be. Already, incidents like Hurricane Katrina and Sandy, which rocked the Gulf of Mexico and the Eastern Seaboard in just the past decade, have shown just how extensive the damage can be.

Historically speaking, cities have been built in fertile river valleys and at river mouths to take advantage of fertile conditions, maritime resources and trade. Agricultural run-offs of sediment, water and nutrients created rich coastal deltas that could support greater food production. This and the good maritime and river connections for trade and transport made these ideal places to live.

Population_curve.svgBut as populations grew, rivers were tapped and diverted for irrigation, industry and canal transport. They were also trapped behind dams and reservoirs for energy and water storage, and depleted by droughts and other extractions. Meanwhile groundwater is increasingly being extracted from beneath cities, and sea levels are rising because of the run-off from the melting of glaciers and thermal expansion of the oceans.

As a result of these changes, many major cities are slowly sinking into the oceans. Our rapid industrialization over the past century has sped these processes, so that now, many urban centers face inundation by storm surges, and we stand to lose many of the most economically important parts of our planet. The loss of these cities will mean a terrible loss of life, economic fallout, and a massive refugee crisis.

Population_densityCities from Bangkok to New York have already experienced emergency flood conditions, and many more are to follow. Those most at risk include Mumbai, Guangzhou, Shanghai, Miami, Ho Chi Minh City, Calcutta, New York City, Osaka-Kibe, Alexandria and New Orleans. More than 3 billion people currently live in coastal areas at risk of global warming impacts such as rising sea levels – a number expected to rise to 6 billion by 2025.

And as was recently learned, the carbon levels in the upper atmosphere have surpassed 400 ppm (parts per million). The last time the atmosphere boasted this concentration of greenhouse gases was the Pliocene Era, a time when sea levels were as much as 60 to 80 feet higher than they current are. If sea levels rise to that level again, we can say goodbye to all these major cities, as well as any that sit on major waterways.

climate_changeshanghaiIt’s not just a matter of water rising up to swallow the coastlines, you see. As the flooding in southern Alberta and the Canadian Prairies demonstrated this week, there’s also the threat of flooding due to increased precipitation and of sewage systems backing up from increased storms and rainfall. These threats make shoring up river deltas and waterways effectively useless, since its not simply a matter of blocking the tides and rivers.

In terms of solutions, a number of major cities are investing in new sea walls, dykes and polders, or high-tide gates – like London’s Thames Barrier – to hold back high waters. In poorer places, people simply endure the problem until they are forced to abandon their homes. As the problem gets worse though, coordinated efforts to rescue people caught in flood zones will need to be mounted.

climate_changedykesAnd there are those who speculate that underwriting the damage will be a waste of time, since no government will be able to afford to compensate its citizens for the untold billions in property damage. In reality, many of these place will simply have to be abandoned as they become unlivable, and those forced out resettled to higher ground or protected communities.

At this point in any lecture on the fate of our planet, people are about ready to abandon hope and hang themselves. Hence, I should take this opportunity to point out that plans for dealing with the problem at the root – cutting our carbon footprint – are well underway. In addition to clean energy becoming more and more feasible commercially, there are also some very viable concepts for carbon capture.

These include inventions like artificial trees and ecoengineering, which will no doubt become absolutely essential in coming years. At the same time though, urban planning and architecture are beginning to embrace a number of alternative and clean technology concepts as part of their design. Not only will future buildings be designed to provide for the needs of their residents – food, water, electricity – in sustainable ways, they will also incorporate devices that can trap smog and turn it into biofuels and other useful products.

Of this, I will be saying more in the next post “Thinking, Breathing Cities of the Future”. Stay tuned!

Source: bbc.com

Asteriod Prospecting by 2015

asteroid_beltDeep Space Industries, a private aerospace company, has been making a big splash in the news lately. Alongside SpaceX, they have been pioneering a new age in space exploration, where costs are reduced and private companies are picking up the slack. And in their latest bid to claim a share of space, the company announced plans late in January to begin asteroid prospecting operations by 2015.

For some time, the concept of sending spaceships to mine asteroids and haul ore has been explored as a serious option. Within the asteroid belt that lies between Mars and Jupiter, countless tons of precious metals, carbon, silicates, and basaltic minerals. If humanity could tap a fraction of a fraction of that mineral wealth, it would be able to supply Earth’s manufacturing needs indefinitely, without all the harmful pollutants or run off caused by mining.

asteroid_miningSo to tap this potential goldmine (literally!) known as the Asteroid Belt, DSI plans to launch a fleet of mini spacecraft into solar orbit to identify potential targets near to Earth that would be suitable to mine. Lacking the resources of some of the bigger players in the space rush, DSI’s probes will ride-share on the launch of larger communications satellites and get a discounted delivery to space.

Initially, a group of 25kg (55 pounds) cubesats with the awesome designation “Firefly” will be launched on a journey lasting from two to six months in 2015. Then, in 2016, the 32 kilograms (70 pound) DragonFly spacecraft will begin their two-to-four-year expeditions and return with up to 68 kilograms (150 pounds) of bounty each. Beyond this, DSI has some truly ambitious plans to establish a foundry amongst the asteroids.

asteroid_foundryThat’s another thing about the Belt. Not only is it an incredibly rich source of minerals, its asteroids would make an ideal place for relocating much of Earth’s heavy industry. Automated facilities, anchored to the surface and processing metals and other materials on site would also reduce the burden on Earth’s environment. Not only would there be no air to befoul with emissions, but the processes used would generate no harmful pollutants.

In DSI’s plan, the foundry would use a patent-pending nickel gas process developed by one of DSI’s co-founders, Stephen Covey, known as “sintering”. This is the same process that is being considered by NASA to build a Moon Base in the Shackleton Crater near the Moon’s south pole. Relying on this same technology, automated foundries could turn ore into finished products with little more than microwave radiation and a 3D printer, which could then be shipped back to Earth.

deepspaceindustries-640x353Naturally, DSI will have plenty of competition down the road. The biggest comes from Google-backed Planetary Resources which staked it claim to an asteroid last April. Much like DSI, they hope to be able to mine everything from water to fuel as well as minerals and rare earths. And of course, SpaceX, which has the most impressive track record thus far, is likely to be looking to the Asteroid Belt before long.

And Golden Spike, the company that is promising commercial flight to the Moon by 2020 is sure to not be left behind. And as for Virgin Galactic, well… Richard Branson didn’t get crazy, stinking rich by letting opportunities pass him by. And given the size and scope of the Belt itself, there’s likely to be no shortage of companies trying to stake a claim, and more than enough for everyone.

So get on board ye capitalist prospectors! A new frontier awaits beyond the rim of Mars…

Source: Extremetech.com

Powered by the Sun: Solar-Powered Reactors

solar2Welcome back to another installment in PBTS! Today’s news item is a rather interesting one, and it comes to us from the University of Delaware where researcher Erik Koepf has come up with an interest twist on solar power. In most cases, scientists think to use cells that can absorb photons and use them to generate a flow of electrons. But in Koepf’s case, sunlight is used in a different way; namely, as a means of creating alternative fuels.

Basically, the concept for Koepft’s new solar-powered reactor revolves around the idea of getting directly to the hydrogen that is found in conventional fuels, i.e. coal and fossil fuels. While they are decent enough energy sources, they do not burn clean, due to the extensive impurities they carry and by-products they create. If it were possible to remove the essential hydrogen from them, we would have a clean burning and efficient energy supply without the hassle of pollution.

Nuclear MOX plant : recycling nuclear waste : Submerged Spent Fuel Elements with Blue GlowAnd that’s where the solar reactor comes in. As the name suggests, the reactor relies on the Sun’s energy, which it then uses to split water molecules to get at their hydrogen atoms. This is done by exposing a zinc oxide powder on a ceramic surface to massive amounts of focused sunlight. From there, a thermochemical reaction happens that splits water apart into oxygen and hydrogen.

Though it may sound complicated, the sheer beauty of this concept lies in that fact that it uses the Sun’s infinite energy to do the heavy lifting and accomplish atom smashing. No particle accelerators, no nuclear fusion or fission; and best of all, no pollution! Since the process creates no emissions or Greenhouse gases, this is perhaps one of the most environmentally friendly energy concepts to date.

But of course, the project has some additional requirement which fall under the heading, “additional parts sold separately”. For one, the reactor needs to get seriously hot – between 1750° to 1950° Celsius (3182° to 3542° Fahrenheit) – before it can get to the work of splitting water molecules. For this, a focusing mirror that is roughly 13 square meters, flawlessly flat and 98% reflective is needed.

solarpowergeNo much mirror existed when Koepf and Michael Giuliano (his research associate) got started, so they had to develop their own. In addition, that mirror needs to focus the solar energy it collects onto a tiny six centimeter circle that has to be precisely aimed. If the light is just a millimeter or two off to one side, the entire reactor could be damaged. In essence, the system is simple and ingenious, but also temperamental and very fragile.

What’s more, just how efficient it is remains to be seen. While the first tests were successful in creating small amounts of hydrogen, the  the real test will take place next month when the duo present their reactor in Zurich, Switzerland, where it will be running at full power for the very first time. Naturally, expectations are high, but it is too soon to tell if this represents the future or a failed attempt at viable alternative power.

Source: Extremetech.com