 After 15 months of observing deep space, scientists with the European Space Agency Planck mission have generated a massive heat map of the entire universe.The “heat map”, as its called, looks at the oldest light in the universe and then uses the data to extrapolate the universe’s age, the amount of matter held within, and the rate of its expansion. And as usual, what they’ve found was simultaneously reassuring and startling.
When we look at the universe through a thermal imaging system, what we see is a mottled light show caused by cosmic background radiation. This radiation is essentially the afterglow of the Universe’s birth, and is generally seen to be smooth and uniform. This new map, however, provides a glimpse of the tiny temperature fluctuations that were imprinted on the sky when the Universe was just 370,000 years old.
 Since it takes light so long to travel from one end of the universe to the other, scientists can tell – using red shift and other methods – how old the light is, and hence get a glimpse at what the universe looked like when the light was first emitted. For example, if a galaxy several billion light years away appears to be dwarfish and misshapen by our standards, it’s an indication that this is what galaxies looked like several billion years ago, when they were in the process of formation.
Hence, like archaeologists sifting through sand to find fossil records of what happened in the past, scientists believe this map reveals a sort of fossil imprint left by the state of the universe just 10 nano-nano-nano-nano seconds after the Big Bang. The splotches in the Planck map represent the seeds from which the stars and galaxies formed. As is heat-map tradition, the reds and oranges signify warmer temperatures of the universe, while light and dark blues signify cooler temperatures.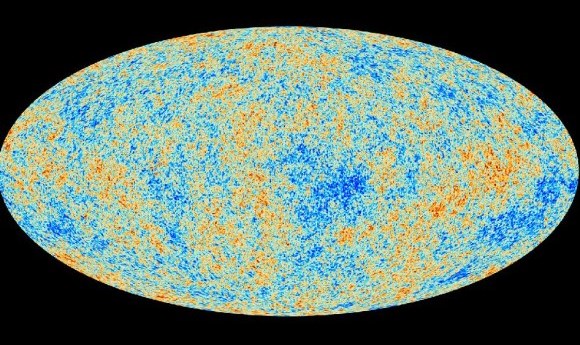
The cooler temperatures came about because those were spots where matter was once concentrated, but with the help of gravity, collapsed to form galaxies and stars. Using the map, astronomers discovered that there is more matter clogging up the universe than we previously thought, at around 31.7%, while there’s less dark energy floating around, at around 68.3%. This shift in matter to energy ratio also indicates that the universe is expanding slower than previously though, which requires an update on its estimated age.
All told, the universe is now believed to be a healthy 13.82 billion years old. That wrinkles my brain! And also of interest is the fact that this would appear to confirm the Big Bang Theory. Though widely considered to be scientific canon, there are those who dispute this creation model of the universe and argue more complex ideas, such as the “Steady State Theory” (otherwise known as the “Theory of Continuous Creation”).
 In this scenario, the majority of matter in the universe was not created in a single event, but gradually by several smaller ones. What’s more, the universe will not inevitable contract back in on itself, leading to a “Big Crunch”, but will instead continue to expand until all the stars have either died out or become black holes. As Krzysztof Gorski, a member of the Planck team with JPL, put it:
This is a treasury of scientific data. We are very excited with the results. We find an early universe that is considerably less rigged and more random than other, more complex models. We think they’ll be facing a dead-end.
Martin White, a Planck project scientist with the University of California, Berkeley and the Lawrence Berkeley National Laboratory, explained further. According to White, the map shows how matter scattered throughout the universe with its associated gravity subtly bends and absorbs light, “making it wiggle to and fro.” As he went on to say:
The Planck map shows the impact of all matter back to the edge of the Universe. It’s not just a pretty picture. Our theories on how matter forms and how the Universe formed match spectacularly to this new data.
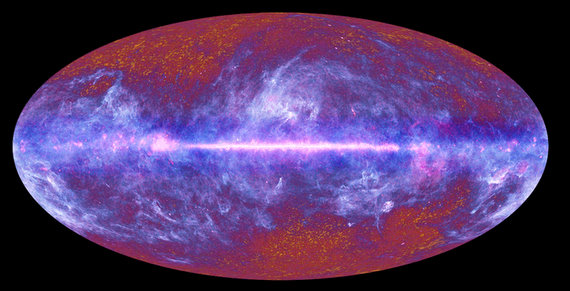
 The Planck space probe, which launched in 2009 from the Guiana Space Center in French Guiana, is a European Space Agency mission with significant contribution from NASA. The two-ton spacecraft gathers the ancient glow of the Universe’s beginning from a vantage more than a million and a half kilometers from Earth. This is not the first map produced by Planck; in 2010, it created an all-sky radiation map which scientists, using supercomputers, removed all interfering background light from to get a clear view at the deep background of the stars.
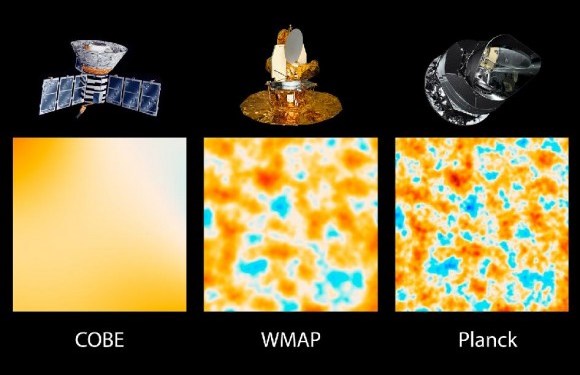
However, this is the first time any satellite has been able to picture the background radiation of the universe with such high resolution. The variation in light captured by Planck’s instruments was less than 1/100 millionth of a degree, requiring the most sensitive equipment and the contrast. So whereas cosmic radiation has appeared uniform or with only slight variations in the past, scientists are now able to see even the slightest changes, which is intrinsic to their work.
So in summary, we have learned that the universe is a little older than previously expected, and that it most certainly was created in a single, chaotic event known as the Big Bang. Far from dispelling the greater mysteries, confirming these theories is really just the tip of the iceberg. There’s still the grandiose mystery of how all the fundamental laws such as gravity, nuclear forces and electromagnetism work together.
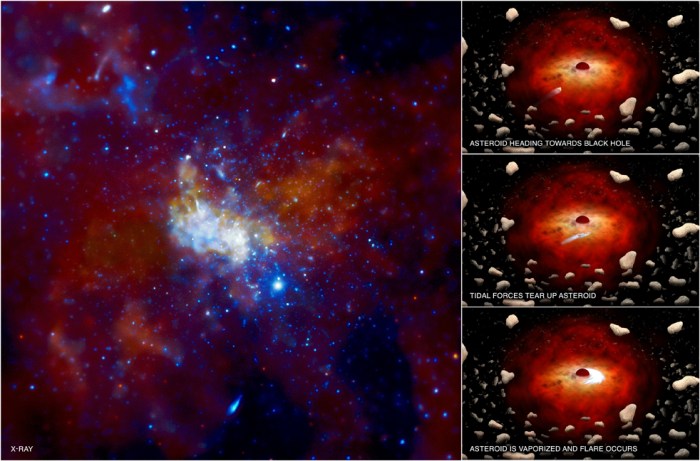
Ah, and let’s not forget the question of what transpires beneath the veil of an even horizon (aka. a Black Hole), and whether or not there is such a thing as a gateway in space and time. Finally, there’s the age old question of whether or not intelligent life exists somewhere out there, or life of any kind. But given the infinite number of stars, planets and possibilities that the universe provides, it almost surely does!
And I suppose there’s also that persistent nagging question we all wonder when we look up at the stars. Will we ever be able to get out there and take a closer look? I for one like to think so, and that it’s just a matter of time!

Sources: universetoday.com, (2), extremetech.com, bbc.co.uk