Your Reputation: The Currency of the Future

reputation_marketingNot too long ago, I did something I haven’t done in a long time and wrote a conceptual post, one which dealt with the concept of the “Internet of Things” and where its leading us. In that spirit, and in the hopes of tackling another concept which has been intriguing me of late, I wanted to delve into this thing known as Reputation Marketing, also known as the Trust Economy.

Here too, the concept has been batted around of late, and even addressed in a Ted Talks lecture (see below). And much like the Internet of Things, it addresses a growing trend that is the result of the digital revolution and everything we do online. To break it down succinctly, Reputation Marketing states that as more and more of our activities are quantified online, our behavior will become commodified, and our actions will become the new currency.

Facebook Reece ElliottAt the heart of this trend is such things as social media, online shopping, and online reviews. With everything from used goods, furniture, clothing and cars to accommodations up for review, people are turning to web-based recommendations like never before. In fact, a 2012 study done by Neilsen Media Research suggested that 70% of all consumers trust online reviews,  which are now second only to personal recommendations.

For some, this represents a positive development, since it means we are moving away from the depersonalized world of institutional production toward a new economy built on social connections and rewards. One such person is Marina Gorbis, who explores the development of what she calls socialstructing in her book The Nature Of The Future: Dispatches From The Socialstructed World. 

NatureOfTheFuture_cover_sml_01In Gorbis’ view, in addition to new opportunities, socialstructing will present new challenges as well. For one, there will be exciting opportunities to create new kinds of social organizations – systems for producing not merely goods but also meaning, purpose, and greater good. But at the same time, there is a possibility that this form of creation will bring new inequities, and new opportunities for abuse.

But at the same time, Gorbis was sure to point out the potential negative consequences. In the same way that one acquires friends on Facebook, or followers on Twitter, people in the near future could be able to hoard social connections for the sake of money, fame, or social standing. Basically, we need to understand the potential disadvantages of socialstructing if we are to minimize the potential pitfalls.

future_money_bitcoinOne such development she points to as an example is the rise of social currencies, such as Paypal, Bitcoin, and others. These operate much differently than regular currencies, as they are intended to facilitate social flows that often operate not on market principles but on intrinsic motivations to belong, to be respected, or to gain emotional support. But once these connections and flows begin to be measured, they may acquire a value of their own.

Basically, if we begin to value these currencies, motivations will arise (not necessarily altruistic ones) to acquire them. So instead of turning market transactions into social flows, we might be turning social interactions into market commodities. In the words of sociologist Chase, we would be applying ontic measurements to ontological phenomena. Or as she puts it in her book:

We created social technologies. Our next task is to create social organizations: systems for creating not merely goods but also meaning, purpose, and greater good. Can we imagine a society of “private wealth holders whose main objective is to lead good lives, not to turn their wealth into capital?” asks political economist Robert Skidelsky. Or better yet, might they turn their wealth into a different kind of capital—social, emotional, or spiritual? Our technologies are giving us an unprecedented opportunity to do so.

botsman-ted
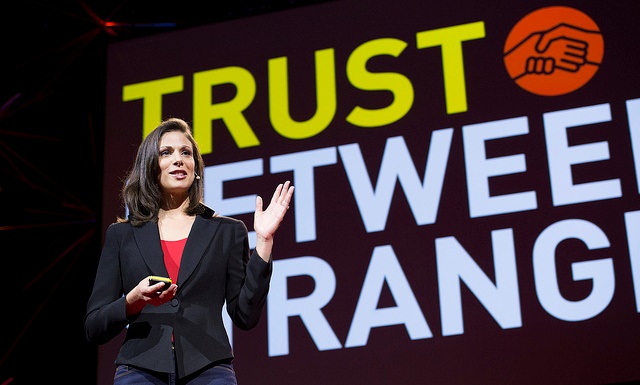
Another person who sees this as a positive development is Rachel Botsman – consultant, author, former director at the William J. Clinton Foundation, and founder of the Collaborative Lab. In her ongoing series of lectures, consultations, and her book What’s Mine Is Yours: The Rise of Collaborative Consumption, she addresses the transformative power collaboration will have, giving rise to such things as “reputation capital” and the “reputation economy”.

In her 2012 Ted Talks lecture she explained how there’s been an explosion of collaborative consumption in recent years. This has embraced everything from the web-powered sharing of cars, to apartments, and even skills. In short, people are realizing the power of technology to enable the sharing and exchange of assets, skills and spaces in ways and on a scale that was never before possible.

collaborative_consumptionBut the real magic behind collaborative consumption, she explained, isn’t in the inventory or the money. It’s in using technology to build trust between strangers, something which is rarely available in the current industrialized, commodities market. Whereas this top-down economic model relies on depersonalized methods like brand name recognition and advertising to encourage consumption, this new model is far more open and democratic.

It is for this reason, and because of the potential it has for empowerment, that Botsman is such an advocate of this emerging trend. In addition to offering opportunities for micro-entrepreneurs , it also provides people with the chance to make human connections and rediscover a “humanness” that has been lost along the way. By engaging in marketplaces that are built on personal relationships, as opposed to “empty transactions”, people are able to reconnect.

future_money
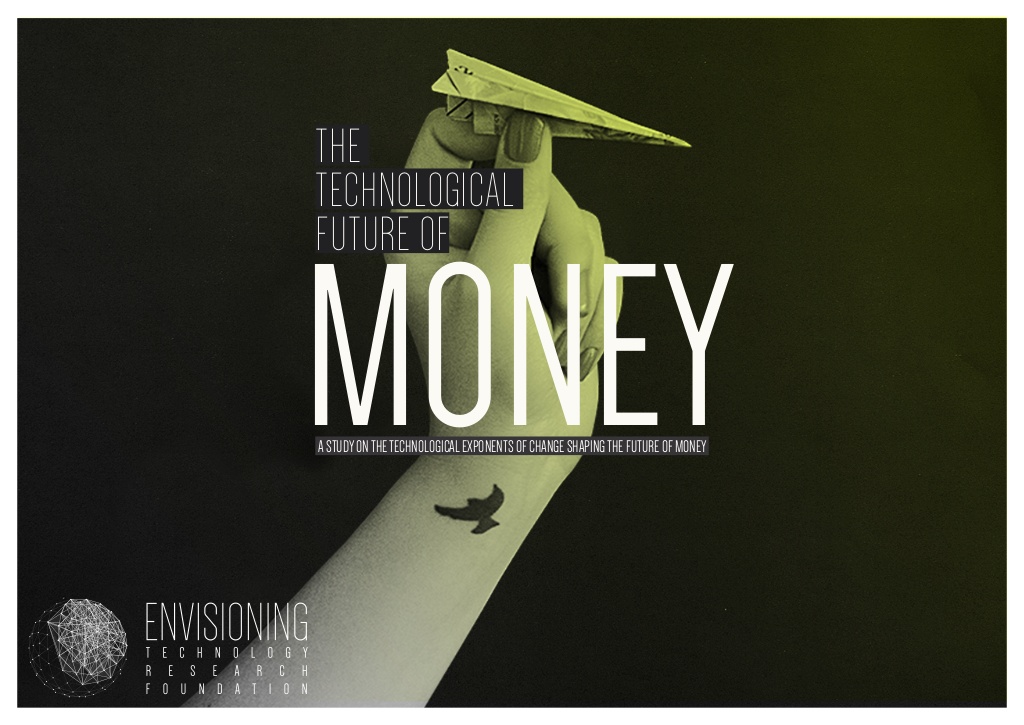
The irony in this, as she states, is that this emerging trend is actually taking us back to old market principles which were thought to have been abandoned with modern industrial economy. Much like how Envisioning Technology predicted with their recent infographic, The Future of Money, this decentralizing, distributed trend has more in common with bartering and shopping at the local agora.

Basically, these behaviors – which predate all the rationalization and vertical/horizontal integration that’s been taking place the industrial revolution – are hardwired into us, but are being updated to take place in the “Facebook age”. Through connections enables by internet access and a worldwide network of optic cables, we are able to circumvent the impersonal economic structures of the 20th century and build something that is more akin to our needs.

future_money2Or, as Botsman summarized it in her article with Wired UK:

Imagine a world where banks take into account your online reputation alongside traditional credit ratings to determine your loan; where headhunters hire you based on the expertise you’ve demonstrated on online forums such as Quora… where traditional business cards are replaced by profiles of your digital trustworthiness, updated in real-time. Where reputation data becomes the window into how we behave, what motivates us, how our peers view us and ultimately whether we can or can’t be trusted…

Another potential irony is the fact that although online shopping does allow people to avoid face-to-face interactions at their local store, it also draws customers to businesses that they may not have otherwise heard about. What’s more, online reviews of local businesses are becoming a boon to entrepreneurs, expanding on the traditional power of written reviews and word of mouth.

And at the risk of making a shameless plug, this all puts me in mind of a short story I wrote back in April, as part of the April 2013 A to Z Challenge. It was called Repute, and deals with a young executive in charge of hiring new talent, in part based on what I referred to as their Reputation Index Placement (RIP), which was basically a tabulation of their digital presence. Like I said, the concept has been on mind for some time!

And of course, be sure to check out Botsman full lecture below:


Sources:
fastcoexist.com, wired.co.uk, ted.com
, envisioning.io

The Future of Money

future_money4The good people over at Envisioning Technology – the independent research organization based on Brazil – have produced yet another intriguing infographic. As some of you may recall, whenever ET has released a new inforgraphic, I’ve been right there to post about it. So far, they have produced graphics addressing the future of Technology, Education, Health, and Finance.

There latest graphic is similarly significant and addresses the future of something that concerns and effects us all: money. Entitled “The Past, Present and Future of Money”, this graph looks at the trends affecting the buying, selling and investment patterns of people over time, contrasting three trends that are interwoven and have moved between centralized, decentralized, and distributed monetary systems.

future_money1In this scenario, centralized tendencies refer to networks where the nodes are connected through dense centers (aka. urban environments), which rely on hierarchically structures institutions (i.e. banks) and require legal tender (physical money). This sort of system relies on an ordered distribution of power, one that generally favor the connected few, and which emerged with the advent of modern industrial civilization.

Decentralized tendencies are those which are based on networks where nodes connect in clusters, that have irregular distributions of power, and favor the selected individual. As the graph shows, these types of networks predate centralized networks, taking the form of bartering and commodities in earliest times, but which have emerged yet again in the modern era and are predicted to continue to grow.

PrintExamples of current and future trends here include crowdsourcing, crowdfunding, banking APIs (Application Programming Interfaces), microfinance, and collaborative consumptions – where access is developed so that consumers can lend, swap, barter, share, and gift products. Whereas this model predates centralized tendencies, it is once again emerging with decentralizing potential of digital technology and open-source databases.

In the third and final method, one which is emerging, is the distributed network of money. These are networks where nodes connect independently, where power is distributed horizontally, and which favor the entire network. This trend began as a result of global real-time communications (i.e. the internet, satellite communications, etc.), and which are expected to expand.

future_money2Combining the concepts of attention economies, digital currencies, peer-to-peer communications, and digital wallets, the essence of this final stage is a network economy that is controlled by individuals, not financial institutions or corporations. In addition, currencies are based shared belief in their value, transactions occur between individuals, and physical currencies are replaced by digital ones.

Other trends that are incorporated and cross-referenced into this infographic include global population versus the number of people per capita who have online access. As it stands, less than half the world’s 7 billion people currently have access to the internet, and are hence able to take part in the decentralizing and distributed trends affecting money. However, the infographic predicts that by 2063, nearly 90% of the world’s 10 billion people will be online.

future_money_bitcoinLike many predictions that I’ve come to know and respect, this latest infographic from ET gives us a glimpse of a future where a Distributed model of politics, economics and technological development – otherwise known as Democratic Anarchy – will be the norm. It’s an exciting possibility, and places history in a new and interesting light. In short, it makes one reconsider the possibility that true socialism might exist.

While this was crudely predicted by Karl Marx, the basic concept is quite intriguing when considered in the context of current trends. What’s more, subsequent thinkers – Max Weber, Proudhon, Gramsci and George Orwell – refined and expressed the principle more eloquently. Nowhere was this more apparent than in the Goldstein Manifesto in 1984, where Orwell addressed how the process of industrial civilization was making class distinction virtually unnecessary.

the_future_of_money_timelineSource: envisioning.io/money/

Visualizing the Internet

Submarine fiber optic cables around the worldOrdinarily, when one talks about visualizing cyberspace, they think of massive neon-structures or cityscapes made up of cascading symbols of data. While these images – the creation of writers like William Gibson and film makers like the Waschowski Brothers – are certainly visually appealing, they are not exactly realistic, and hardly do the real thing justice.

Thankfully, a recent article over at policymic has presented us with a new and interesting way of visualizing this thing we call the World Wide Web. By compiling images of the various deep-sea cables that allow us to transmit information at the speed of light, author Laura Dimon reminds us that while the internet may be made up of trillions of bits of data moving about at any given moment, it is dependent upon real-world physical connections.

Submarine Cable Map 2012And these connections are extensive, with more than 550,000 fiber optic cables running along the ocean floor that are responsible for transmitting trillions upon trillions of interactions per day. According to the Washington Postthese cables “wrap around the globe to deliver emails, web pages, other electronic communications and phone calls from one continent to another.”

But surprisingly, few people seem to truly appreciate this. In an age of WiFi where more and more networks are being added to our public airwaves every day, the perception that all this information is something ethereal seems to have become rooted. Luckily, real-world events – such as the severing of several Seacom cables off the coast of Alexandria back in March – have managed to remind people just how grounded and potentially vulnerable the internet is.

Global Internet Map 2012Given our immense and increasing reliance on the internet for business, personal communications, entertainment and shopping, one would that we as a people would possess at least a passing knowledge of how it works. But as Eric Schmidt, Google’s executive chair, claimed in his book The New Digital Age: “The internet is among the few things humans have built that they don’t truly understand.”

Luckily, Laura provides a breakdown in her article which is a good start:

It consists of tens of thousands of interconnected networks run by service providers, individual companies, universities, and governments. There are three major parts to its construction: the networks that physically connect to each other (with about 12 that are particularly significant); the data-storing centers; and the architecture that lies in between. That is where it gets really interesting.

Global Internet Map 2011And just in case this doesn’t provide a clear picture, there are numerous images that have been created by organizations like Telecom Maps and The Fiber Optic Association. These show just how immense, extensive, and crisscrossed the cables that bring us all our emails, videos, blog feeds, and ability to surf are.

In addition, they also remind us that the historic gap between the developed and underdeveloped world persists into the information age. For every network of cables, there are cable landing stations that connect the deep sea lines to the continent they are servicing. As the maps show, Europe has more international network capacity than any other world region.

Global Voice Traffic Map 2010

They also remind us that the once undisputed technological supremacy of the United States has been slowly eroding as humanity enters the 21st Century. This has been especially apparent within the last decade, where localized service providers have eschewed the US as a central hub and begun to connect their networks to other countries and regions.

Fascinating, and educational. I hope someday to be able to use these sorts of visualizations in the classroom, as a means of letting students know what enables all their surfing habits. I imagine most of them will be surfing on their smartphones as I speak!

Sources: policymic.com, telegeography.com, thefoa.org

The Ultimate Spaceship Size Chart

Star_Trek_Spacedock My thanks to my friend, fellow indie writer and collaborater Goran Zidar, who let me know about this chart. As fans of science fiction and space opera are sure to know, these spaceship size charts have been around for some years. They take familiar vessels from different franchises and group them according to scale. They’re cool, they’re fun; and assuming they’re accurate, it’s kind of amazing anyone took the time to actually compile the specs for comparison.

Well as it happens, this latest one claims to take every single ship from every sci-fi franchise and combine them in one infographic. Quite the claim, I know. But one look and you have to admit, its pretty jam-packed and more than a little thorough. But if you can think of something they missed, I’d be interested to hear about it. Lord knows there are plenty of geeks out there who don’t like seeing their favorite franchise get overlooked. I should know, I’m one of them!

Just click on the image below to enlarge and see if you can spot your favorite space-faring vessel:

spaceship_sizechartSource: img.gawkerassets.com


World War Z: Novel vs. Movie

worldwar_zI’ll admit right off the bat that I haven’t seen the movie yet. But having bought the book recently and delved into it, I could tell right away when the previews hit that director Marc Forster and his crew of writers had no intention of following it at all. Sure, it looked like it good be exciting, and a good shoot em movie, but calling it an “adaptation” seemed like a stretch at best.

If anything, it appeared that Max Brook’s awesome and thoughtful story about a man who is going around the world and assembling post-facto oral accounts about the zombie apocalypse – how and where it began, what the signs were, how people survived – was little more than a guideline for a big budget disaster flick. If there was any doubt, the fact that Brad Pitt was cast as the lead silenced them all in a nanosecond.

Luckily, stuff like this allows other people to come up with good satire. Case in point, this infographic created by the folks over at The Oatmeal. In addition to providing all kinds of funny, happy ecards, infographics and jokes, they are also a place where one can pledge money for the new Arkyd program – the crowdfunded telescope you can have you picture placed on for $25.

world_warz_infoHere, they show the movie and book as two spheres, indicating that they overlap in one important way: they have the same name! Yep, that’s it. In every other capacity, except for the fact that it involves a zombie apocalypse and Brad Pitt’s character loosely resembles the narrator in the book, the movie and book could not be more different.

Personally, I think I’ll see it anyway. Maybe not in the theater, but it might be a good candidate for rental or Netflix. The wife thinks it looks like fun and I know that my curiosity won’t be satisfied until I witness this “adaptation” firsthand. Peace out, and go for the brain!

Source: theoatmeal.com

Climate Crisis: Population Growth in Coming Years

trafficWhen it comes to populations and environmental problems, cities are at the very heart of the issue. Not only are they where the majority of humanity lives, a reality which will only get worse as time goes on, they are also the source of most of our pollution, waste, and land use. People require space to live and work, as well as food, water and

Last year, the world’s population increased to 7 billion, which represents a seven-fold increase in the space of the last two centuries. What’s more, the proportion of people living in urban centers (as opposed to rural) shot up from 3% to almost half of the world’s people. This rate of population growth and redistribution is unprecedented, and is not likely to slow down anytime soon.

urbanworld_50Consider the following series of infographics which were released by Unicef with the help of the design studio Periscopic. Titled “An Urban World”, they illustrate the issues of population growth and distribution. This interactive, HTML5 visualization of the world covers the years of 1950-2050. But rather than showing our geographic boundaries, every country* is depicted only by their population living in urban environments.

As you can see, each country is represented by a circle that depicts the number of people living in urban environments. As these populations grow, the circles get bigger. And as urban populations get more dense, the circles shift from green to blue to yellow to fuchsia. Immediately, a glaring fact is made clear: the problem is getting worse and at an alarming rate.

urbanworld_2000In addition, there are several nuggets of info which are staggering and particularly worrisome. For example, by 2050, both China and India will have about a billion people living in cities alone. In addition, since the 1990s, more than 75% of the U.S. population has lived in cities. At one time, the US was an outlier in this regard, but found ourselves joined over the next two decades by France, Spain, the U.K., Mexico, Korea, Australia, and Brazil.

But of course, this growth need not be a bad thing. When all is said and done, humanity has a choice. One the one hand, these megacities can take the form of smartly scaled communities of loosely populated expanses and efficient agriculture. On the other, they could easily take the form of urban slums and underdeveloped countrysides that are stricken by poverty and filthy.

urbanworld_2050It’s a complex issue, no doubt about it, especially when you consider the flip side to the whole equation. As the saying goes, every new life means a new mouth to feed, but also a pair of working hands. What’s more, studies have shown that people living in cities tend to be far more energy efficient, and that energy surplus is usually directed toward more and more technological growth and innovation.

Seen in this light, the massive cities of the future could be hubs for the ongoing development of new energies and creative living solutions. And with more people living in large, connected, interdependent environments, the more business startups, ideas, and contributions were likely to get. Part of the reason we have seen so much progress in solar, piezoelectric motors, and bio-electricity is because of this trend. More growth will conversely mean more clean energy.

overpopulation Quite the paradox, really. Who knew people could be both the cause and solution to the world’s worst problem! In the meantime, feel free to head on over to the Unicef site and watch this interactive infographic. Just press play, and watch the cities of the world swell at the edges, competing for room on the page as they compete for room on this planet.

Also, be sure to take a gander at this infographic from BBC Future that demonstrates the current population of the world’s major cities per square meter, the projected population per square meter by 2050, and the livability rating of the city in question. They even provide some context at the bottom by showing the size of relative spaces – from prison cells to Olympic swimming pools, and comparing that to the average space an urban dweller enjoys.

city_spaces
Sources:
bbc.com, fastcodesign.com
, unicef.org

The Future of the Classroom

virtual_learning2As an educator, technological innovation is a subject that comes up quite often. Not only are teachers expected to keep up with trends so they can adapt them into their teaching strategies, classrooms,and prepare children in how to use them, they are also forced to contend with how these trends are changing the very nature of education itself. If there was one thing we were told repeatedly in Teacher’s College, it was that times are changing, and we must change along with them.

And as history has repeatedly taught us, technological integration not only changes the way we do things, but the way we perceive things. As we come to be more and more dependent on digital devices, electronics and wireless communications to give us instant access to a staggering amount of technology, we have to be concerned with how this will effect and even erode traditional means of information transmission. After all, how can reading and lecture series’ be expected to keep kid’s attention when they are accustomed to lighting fast videos, flash media, and games?

envisioning-the-future-of-education

And let’s not forget this seminal infographic, “Envisioning the future of educational technology” by Envisioning Technology. As one of many think tanks dedicated to predicting tech-trends, they are just one of many voices that is predicting that in time, education will no longer require the classroom and perhaps even teachers, because modern communications have made the locale and the leader virtually obsolete.

Pointing to such trends as Massive Open Online Courses, several forecasters foresee a grand transformation in the not too distant future where all learning happens online and in virtual environments. These would be based around “microlearning”, moments where people access the desired information through any number of means (i.e. a google search) and educate themselves without the need for instruction or direction.

virtual_learning3The technical term for this future trend is Socialstructured Learning = an aggregation of microlearning experiences drawn from a rich ecology of content and driven not by grades but by social and intrinsic rewards. This trend may very well be the future, but the foundations of this kind of education lie far in the past. Leading philosophers of education–from Socrates to Plutarch, Rousseau to Dewey–talked about many of these ideals centuries ago. The only difference is that today, we have a host of tools to make their vision reality.

One such tool comes in the form of augmented reality displays, which are becoming more and more common thanks to devices like Google Glass, the EyeTap or the Yelp Monocle. Simply point at a location, and you are able to obtain information you want about various “points of interest”. Imagine then if you could do the same thing, but instead receive historic, artistic, demographic, environmental, architectural, and other kinds of information embedded in the real world?

virtual_learningThis is the reasoning behind projects like HyperCities, a project from USC and UCLA that layers historical information on actual city terrain. As you walk around with your cell phone, you can point to a site and see what it looked like a century ago, who lived there, what the environment was like. The Smithsonian also has a free app called Leafsnap, which allows people to identify specific strains of trees and botany by simply snapping photos of its leaves.

In many respects, it reminds me of the impact these sorts of developments are having on politics and industry as well. Consider how quickly blogging and open source information has been supplanting traditional media – like print news, tv and news radio. Not only are these traditional sources unable to supply up-to-the-minute information compared to Twitter, Facebook, and live video streams, they are subject to censorship and regulations the others are not.

Attractive blonde navigating futuristic interfaceIn terms of industry, programs like Kickstarter and Indiegogo – crowdsources, crowdfunding, and internet-based marketing – are making it possible to sponsor and fund research and development initiatives that would not have been possible a few years ago. Because of this, the traditional gatekeepers, aka. corporate sponsors, are no longer required to dictate the pace and advancement of commercial development.

In short, we are entering into a world that is becoming far more open, democratic, and chaotic. Many people fear that into this environment, someone new will step in to act as “Big Brother”, or the pace of change and the nature of the developments will somehow give certain monolithic entities complete control over our lives. Personally, I think this is an outmoded fear, and that the real threat comes from the chaos that such open control and sourcing could lead to.

Is humanity ready for democratic anarchy – aka. Demarchy (a subject I am semi-obsessed with)? Do we even have the means to behave ourselves in such a free social arrangement? Opinion varies, and history is not the best indication. Not only is it loaded with examples of bad behavior, previous generations didn’t exactly have the same means we currently do. So basically, we’re flying blind… Spooky!

Sources: fastcoexist.com, envisioningtech.com

Powered By The Sun: Visualizing Swanson’s Law

solar_power1For decades, solar power has been dogged by two undeniable problems that have prevented it from replacing fossil fuels as our primary means of energy. The first has to do the cost of producing and installing solar cells, which until recently remained punitively. The second has to do with efficiency, in that conventional photovoltaic cells remained inefficient as far as most cost per watt analyses went. But thanks to a series of developments, solar power has been beating the odds on both fronts and coming down in price.

However, to most people, it was unclear exactly how far it had come down in price. And thanks to a story recently published in The Economist, which comes complete with a helpful infographic, we are now able to see firsthand the progress that’s been made. To call it astounding would be an understatement; and for the keen observer, a certain pattern is certainly discernible.

PPTMooresLawaiIt’s known as the “Swanson Effect” (or Swanson’s Law), a theory that suggests that the cost of the photovoltaic cells needed to generate solar power falls by 20% with each doubling of global manufacturing capacity. Named after Richard Swanson, the founder of the major American solar-cell manufacturer named SunPower, this law is basically an imitation of Moore’s Law, which states that every 18 months or so, the size of transistors (and also their cost) halves.

What this means, in effect, is that in solar-rich areas of the world, solar power can now compete with gas and coal without the need for clean energy subsidies. As it stands, solar energy still accounts for only  a quarter of a percent of the planet’s electricity needs. But when you consider that this represents a 86% increase over last year and prices shall continue to drop, you begin to see a very trend in the making.

What this really means is that within a few decades time, alternative energy won’t be so alternative anymore. Alongside such growth made in wind power, tidal harnesses, and piezoelectric bacterias and kinetic energy generators, fossil fuels, natural gas and coal will soon be the “alternatives” to cheap, abundant and renewable energy. Combined with advances being made in carbon capture and electric/hydrogen fuel cell technology, perhaps all will arrive in time to stave off environmental collapse!

Check out the infographic below and let the good news of the “Swanson Effect” inspire you!:

swanson_effectSource: theeconomist.com

Drone Wars: New Promises, Same Problems

(U.S. Air Force photo/Staff Sgt. Brian Ferguson)(Released)The practice of using UAV’s as part of a targeted strategy in Pakistan, Afghanistan, Somalia and Yemen has become so frequent that its come to characterize the Obama administration’s handling of the “War on Terror”. Reaction to this policy has been increasingly critical, due in no small part to unanswered questions surrounding civilian death tolls and the rapid escalation of deployment. In response, the Obama administration announced this past week that the surge is at an end.

In a speech made to the National Defense University in Washington on Thursday, Obama emphasized that from now on, the use of UAV’s would be in the hand of the military instead of clandestine intelligence organizations such as the CIA. He also indicated that the rules for launching the strikes would be stricter. For instance, there must be a “near certainty” that no civilians will be killed, and the strikes are to become less frequent.

predator_profileWhile Obama would not declare an end to the war on terrorism, he did offer to work with Congress to constrain some of his own authorities for waging it, which may include the creation of a court modeled on the secretive one used by the NSA to oversea the surveillance of suspected foreign agents. He also expressed a preference to constrain “and ultimately repeal” the broad latitude of warmaking powers granted in the Authorization to Use Military Force (AUMF), an act that was created in 2001 by the Bush administration which is considered the wellspring of the “War on Terror”.

And above all, issues of legality are to take a backseat to the moral and ethical implications raised by ongoing use. Or as he put it: “To say a military tactic is legal, or even effective is not to say it is wise or moral in every instance.”

Naturally, a great many questions remain. In addition to how drones will be used in the years to come to combat terrorism and militants, there’s also questions surrounding their use thus far. Despite pledges made by Obama that changes will be made, the history of the program is still shrouded in mystery. Fittingly, Bloomberg Businessweek created a map to serve as a reminder of the scope of that program, calling it the first ever “comprehensive compilation of all known lethal U.S. drone attacks.”

drone_map

It should be noted though that the numbers represent an estimate which were compiled with the help of the nonprofit Bureau of Investigative Journalism. Sources in Washington apparently offer a wide range of numbers, and the State Department remains hush hush on the issue of casualties. However, the estimates presented in this infographic still present a stark and sobering picture:

  • Yemen: at least 552 killed between 2002 and 2013. The site of the first ever drone strike in 2002.
  • Pakistan: at least 2,561 killed between 2004 and 2013.
  • Somalia: at least 23 killed between 2011 and 2012.

drone_map1Naturally, it is hoped that Obama’s promise to curb the use of drones represents a renewed commitment to comply with international law, treaties and human rights. However, what was apparently missing from the speech was an indication about how easy it will be to get information about strikes that are made in the future. According to the New York Times’ Mark Mazzetti, who provided live analysis of the speech, Obama’s speech didn’t address the issue:

One of the big outstanding questions is just how transparent the Obama administration will be about drone strikes in the future. Will administration officials begin to publicly confirm strikes after they happen?

There was no mention of this in the speech, and it is telling that the president did not mention the C.I.A. at all. It seems quite certain that past operations in Pakistan, Yemen and elsewhere are not going to be declassified anytime soon.

Also, moving operations from the C.I.A. to the Pentagon does not automatically mean that the strikes will be publicly discussed. The Pentagon is carrying out a secret drone program in Yemen right now, and it is very difficult to get information about those operations.

So… promises to curb the use of drones have been made, as well as promises to create some kind of oversight for future operations. And this does seem consistent with many of the criticisms made about the ongoing war on terrorism, specifically the Bush administrations handling of it and how his reliance on special executive powers were unlawful and unconstitutional.

But until such time as information on how these strikes occur and who is being killed, the issue will remain a contentious and divisive one. So long as governments can wage war with automated or remote machinery and kill people without transparency and in secrecy, will this not constitute a form of illegal – or at the very least, a very opaque – warfare?

Sources: wired.com, fastcoexist.com, businessweek.com

GOT Infographic: The History of Robert’s Rebellion

House-a-song-of-ice-and-fire-29965891-1920-1080

Things have been getting weird around here lately. For some reason, people over at other sites have been reaching out to me and offering cool and funny infographics. It’s like they think that I’ve got some kind of following or something. Well, if it keeps me getting stuff like this, I plan to let them entertain this notion. And my followers, whoever you are, can consider yourself the lucky recipient of what they pass on.

Consider this new infographic, courtesy of connectyourhome.com. For fans of Game of Thrones, be it the books or the miniseries, this helpful illustrated and annotated table provides a breakdown of the history of Robert’s Rebellion. For those who are not familiar, this rebellion is what made King Robert ruler of the Seven Kingdoms, and were seminal to the plot of the story that followed.

Rhaegar-Targaryen-Lyanna-StarkThings begin in this timeline with the tournament at Harrenhal, during which Rhaegar Targaryen kidnapped Lyanna Stark, the betrothed of Robert Baratheon. They then escalated when Rickard and Brandon Stark – Ned Stark’s father and uncle and the men his youngest boys are named after – travelled to King’s Landing to demand Lyanna’s return. However, “the mad” King Aerys accused both men of treason, burns Rickard and has Brandon strangled.

Aerys further demands that John Arryn, Lord of the Eyrie and Robert Baratheon’s gaurdian, to deliver the heads of Eddard (Ned) and Robert to him, since their fathers were apparent traitors. Instead, Arryn allies himself with Robert and Eddard and a rebellion is declared. House Tully, with is joined to house Stark through the marriage of their eldest daughter (Catelyn) to Ned, joins them as well.

Battle_of_the_TridentAnd of course, a series of battles follow, culminating in the Battle of the Trident where Rhaegar is killed and the royal army is routed. The rebel army marches on King’s Landing with the intent of laying seige. Tywin Lannister, Lord of Casterly Rock, rides there and tricks King Aerys into allowing his forces into the city, and then sacks it. Jaime Lannister, who is then ordered to murder his own father, slays King Aerys and the rebellion is at an end.

Robert Baratheon is crowned king and marries Tywin’s daughter, Cersei Lannister, to seal his control over the realm. The last of the Targaryens are murdered or forced into exile, the two that are publicly known of are Viserys and Daenerys. Ned rides to Dorne where his sister was being held in the Tower of Joy, where he finds her dying and agrees to honor her last wishes.

And that’s what brings us to the first book and/or season with the laying of all the major threads, with the exception of all that stuff involving the White Walkers and the Wall. That stuff goes back… further! But don’t trust my executive summary, go to their website or check out the infographic below:

got-infographicNot only is it a very interesting breakdown of the plot that predates events in the main story, I think it also confirms something that’s been batted around various GOT forums. For some time, people have been wondering about the true identity of John Snow’s mother. Some people have theorized that he was in fact Lyanna and Rhaegar’s love child, and that she asked Ned to keep him safe by keeping his identity a secret.

Targaryen children were being murdered at this time, after all. And saying it was his own love child somehow seemed more humane to the boy and his mother’s memory. Sure, it was a blow to Catheryn to believe her husband was coming home with a bastard born of an indiscretion. But Ned was a man of honor, a boy’s life may have been at stake, and a sister’s dying wish is a sister’s dying wish!

So thanks connectyourhome! And if you got any more, don’t hesitate to send them along. I can’t speak for everyone, but I know I enjoy them 😉